OVRO-LWA Operation Notes
Starting solar beamforming observations
- Log into lwacalim10 using your own account (this is the only node that allows submissions)
- Activate the deployment conda environment
conda activate deployment
- Check what schedules are there
lwaobserving show-schedule
- Submit the schedule for the next 7 days (note that sdf files are written to /tmp/solar_<date>_
ipython
cd /home/dgary
import make_solar_sdf
make_solar_sdf.multiday_obs(ndays=7)
- Calibrate the beam (if needed, using the same Python session)
from mnc import control
con=control.Controller('/opt/devel/dgary/lwa_config_calim_std.yaml')
con.configure_xengine(['dr2'], calibratebeams=True)
If the beam is already calibrated, the con.configure_xengine command will say that and return immediately. If for any reason you want to override the current calibration, instead type
con.configure_xengine(['dr2'], calibratebeams=True, force=True)
Starting slow and fast visibility recorders
- Log into lwacalim10 using your own account
- Check the recorder status by going to http://localhost:5006/LWA_dashboard
- Activate the environment and configure
conda activate deployment
ipython
cd /home/pipeline/proj/lwa-shell/mnc_python/
from mnc import control
con=control.Controller('/opt/devel/dgary/lwa_config_calim_std.yaml')
- Start the recorders
con.start_dr(['drvs', 'drvf'])
- Check the recorder status in command line
con.status_dr()
Restart slow and fast visibility recorder services (experts only!)
Occasionally, one would see slow and/or fast images on certain bands showing "No Data" all the time. This is the time to suspect that the recorder services need to be restarted. To check this, do the following:
- Log into lwacalim10 and check the recorder status by going to http://localhost:5006/LWA_dashboard. If the recorder services are okay but not started, they show as "normal, idle." In this case, one can just start the recorders following the previous section. If recorders show up as "shutdown," then we need to restart the recorder services.
- Check if the data are being written to disk. One can run the following script for a given day (format yyyy-mm-dd)
source /opt/devel/dgary/check_recording.sh 2024-09-27
If all data are being recorded, it would list all the hours of the day that have data. Otherwise, something like the following would be shown
ls: cannot access '/lustre/pipeline/slow/32MHz/2024-09-27/': No such file or directory
ls: cannot access '/lustre/pipeline/slow/69MHz/2024-09-27/': No such file or directory
ls: cannot access '/lustre/pipeline/fast/32MHz/2024-09-27/': No such file or directory
ls: cannot access '/lustre/pipeline/fast/69MHz/2024-09-27/': No such file or directory
To determine which server node that hosts the recorders, use the following mapping:
13 MHz, 50 MHz → lwacalim01
18 MHz, 55 MHz → lwacalim02
23 MHz, 59 MHz → lwacalim03
27 MHz, 64 MHz → lwacalim04
32 MHz, 69 MHz → lwacalim05
36 MHz, 73 MHz → lwacalim06
41 MHz, 78 MHz → lwacalim07
46 MHz, 82 MHz → lwacalim08
In the example above, the problem lies in the slow and fast recorders on node lwacalim05. To fix them, do the following
- Log in to the respective node (lwacalim05 in this example) as the "pipeline" user (only a few of us have the privilege)
- Restart the slow and fast services. Each node hosts two slow recorders and two fast recorders. The slow recorders are named dr-vslow-[m1] and dr-vslow-[m2], where m1=2n-1 and m2=2n, with n the node number (5 in this example). Similarly, the fast recorders are named dr-vfast-[m].
systemctl --user restart dr-vslow-9
systemctl --user restart dr-vslow-10
systemctl --user restart dr-vfast-9
systemctl --user restart dr-vfast-10
Once this is done, check http://localhost:5006/LWA_dashboard again. The recorders in question should show as "normal, idle." The last step is to start the recorders following the steps in the previous section, e.g.,
con.start_dr(['drvs', 'drvf'])
Don't worry if you see messages such as "'Failed to schedule recording start: Operation starts during a previously scheduled operation'" for recorders that are already working. Pay attention to those weren't working, and they should display something like "'drvs8002': {'sequence_id': '7428a3d67cee11ef80113cecef5ef4c6', 'timestamp': 1727454906.4683754, 'status': 'success', 'response': {'filename': '/lustre/pipeline/slow/'}}". Lastly, check if the recorders are back and the data are flowing.
con.status_dr(['drvs', 'drvf'])
Restart Xengine
If for some reason the entire Xengine is not working (e.g., the OVRO-LWA system health board shows that they are all red), one can do the following to restart it.
lwamnc start-xengine --full
Check/Set ARX attenuator settings
Under the "deployment" environment
> cd /home/pipeline/proj/lwa-shell/mnc_python/
> from mnc import settings
> s = settings.Settings()
> last = s.get_last_settings()
# last is a dictionary that contains the last setting information. The time is in mjd
> print(last)
{'time_loaded': 60607.64228738569, 'user': 'bin.chen', 'filename': '20240922-settingsAll-day.mat'}
> from astropy.time import Time
> Time(last['time_loaded'], format='mjd').isot
Out[25]: '2024-10-24T15:24:53.630'
List all the settings:
s.list_settings()
If last['filename'] != the latest daytime file ("20240922-settingsAll-day.mat" in this case), set it to the latest.
settings.update('/home/pipeline/opsdata/20240922-settingsAll-day.mat')
Check bad antennas
Andrea Isella produces reports of the antenna health at this link. The lists can be accessed using the method below on the lwacalim nodes.
conda activate deployment
ipython
cd /home/pipeline/proj/lwa-shell/mnc_python/
from mnc import anthealth
badants = anthealth.get_badants('selfcorr')
Check the time and antenna list of the latest report
from astropy.time import Time
Time(badants[0], format='mjd').isot
print(badants[1])
Note that the output antenna list refer to the antenna names, but not the "correlator numbers" or CASA antenna indices.
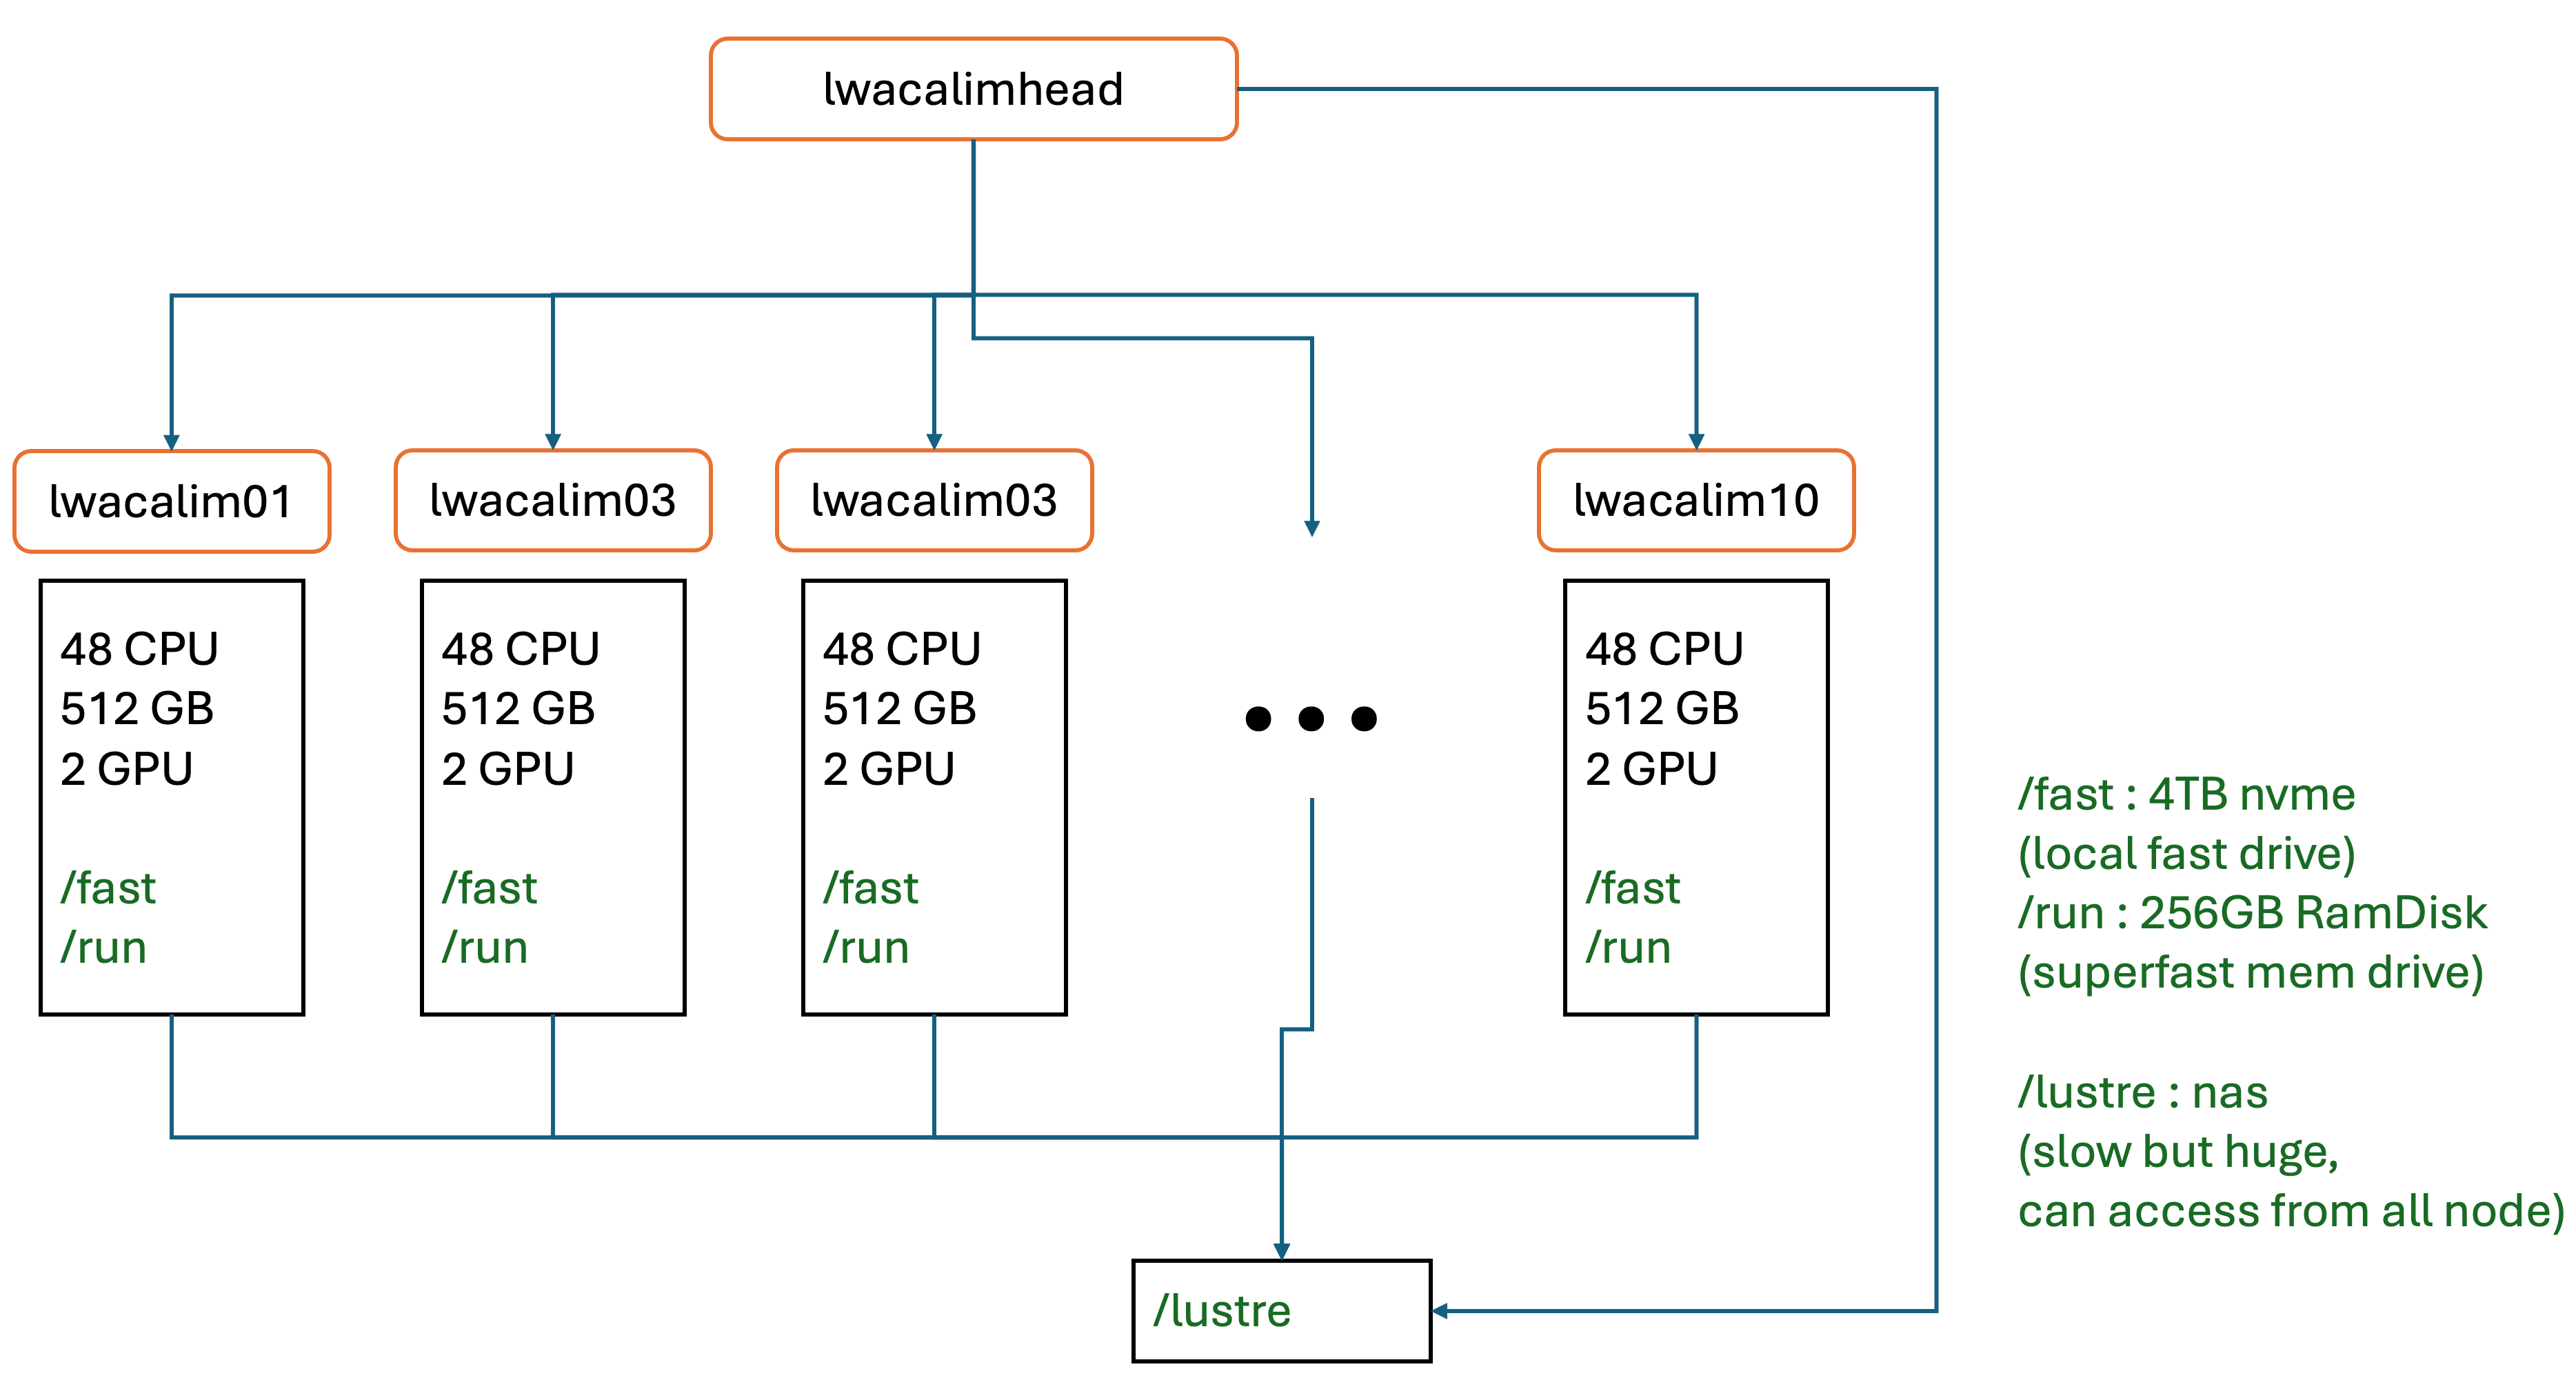
Realtime Pipeline and Calim (Slurm)
Resource
Calim cluster (2024-Sep-19)
- Partition: general (10)
- 48 CPU, 512GByte memory, 2 GPU (RTX A4000, 16GByte)
Slurm basics
Full guide: [1]
Commands
sinfo # print the overview of the Slurm system
squeue # show the current queue, including the running and queueing jobs, with jobID
scancel <job id> # cancel the (running/queueing) job, the resource will be released
Ideally, during solar observation, using the command squeue should get status "R" for solarpipe:
squeue -u solarpipe
output:
             JOBID PARTITION     NAME     USER ST       TIME  NODES NODELIST(REASON)
              6986     solar solarpip solarpip  R    6:55:02      7 lwacalim[04-10]
              6985     solar solarpip solarpip  R    6:55:04      7 lwacalim[04-10]
If not, report to the slack ovro-lwa channel.
To restart the pipeline, do:
scancel -u solarpipe # !this will kill all task under solarpipe!
and
sbatch /lustre/peijin/ovro-lwa-solar-ops/runSlurm_solarPipeline.sh slow
sbatch /lustre/peijin/ovro-lwa-solar-ops/runSlurm_solarPipeline.sh fast
