Total Power Calibration: Difference between revisions
| (One intermediate revision by the same user not shown) | |||
| Line 1: | Line 1: | ||
== EOVSA Total Power Calibration Method, Observations, and Analysis == | == EOVSA Total Power Calibration Method, Observations, and Analysis == | ||
[[File: Quick_Start.png|thumb|600px|The background and procedures described in this section are largely automatic, and only a single routine is needed to complete the analysis and write the results into the SQL database for later retrieval. This should be done each day, and although even this can be automated, it is worthwhile to see the calibration plot result. In Python, issue these commands | |||
<pre>import calibration as cal | |||
from util import Time | |||
t = Time('2017-09-08 17:30') # Time is the time of one of the SOLPNTCAL observations for that day | |||
cal.solpnt2sql(t) | |||
</pre> | |||
The program will show two multi-panel plot windows, and ask | |||
<pre>'Okay to write result to SQL database? [Y/N]: '</pre> | |||
Examine the plots, and if satisfied, enter Y to write to the SQL database. | |||
]] | |||
The current EOVSA system should now be amenable to total power calibration based on RSTN/Penticton total solar flux density measurements. The outline of the method is to read the daily flux density measurements available from NOAA (e.g. [ftp://ftp.swpc.noaa.gov/pub/lists/radio/45day_rad.txt]), calculate a suitable mean value for the multiple measurements made during the day, apply a second-order fit for interpolation/extrapolation to the EOVSA frequencies (<math>f</math>), and then adjust the flux density to account for the finite size of the EOVSA (2.1-m diameter) antennas. Once this as-observed flux density spectrum <math>S(f)</math> is known, the results of daily SOLPNTCAL observations are used to determine the on-Sun spectrum for antenna <math>i</math>, polarization <math>p</math>, <math>S_{on}(p,f,i)</math>, and off-Sun spectrum for antenna <math>i</math>, polarization <math>p</math>, <math>S_{off}(p,f,i)</math>. The resulting calibration factors for antenna <math>i</math> are determined as | The current EOVSA system should now be amenable to total power calibration based on RSTN/Penticton total solar flux density measurements. The outline of the method is to read the daily flux density measurements available from NOAA (e.g. [ftp://ftp.swpc.noaa.gov/pub/lists/radio/45day_rad.txt]), calculate a suitable mean value for the multiple measurements made during the day, apply a second-order fit for interpolation/extrapolation to the EOVSA frequencies (<math>f</math>), and then adjust the flux density to account for the finite size of the EOVSA (2.1-m diameter) antennas. Once this as-observed flux density spectrum <math>S(f)</math> is known, the results of daily SOLPNTCAL observations are used to determine the on-Sun spectrum for antenna <math>i</math>, polarization <math>p</math>, <math>S_{on}(p,f,i)</math>, and off-Sun spectrum for antenna <math>i</math>, polarization <math>p</math>, <math>S_{off}(p,f,i)</math>. The resulting calibration factors for antenna <math>i</math> are determined as | ||
Latest revision as of 04:33, 10 September 2017
EOVSA Total Power Calibration Method, Observations, and Analysis
import calibration as cal
from util import Time
t = Time('2017-09-08 17:30')   # Time is the time of one of the SOLPNTCAL observations for that day
cal.solpnt2sql(t)
The program will show two multi-panel plot windows, and ask 'Okay to write result to SQL database? [Y/N]: 'Examine the plots, and if satisfied, enter Y to write to the SQL database.
The current EOVSA system should now be amenable to total power calibration based on RSTN/Penticton total solar flux density measurements. The outline of the method is to read the daily flux density measurements available from NOAA (e.g. [1]), calculate a suitable mean value for the multiple measurements made during the day, apply a second-order fit for interpolation/extrapolation to the EOVSA frequencies (), and then adjust the flux density to account for the finite size of the EOVSA (2.1-m diameter) antennas. Once this as-observed flux density spectrum is known, the results of daily SOLPNTCAL observations are used to determine the on-Sun spectrum for antenna , polarization , , and off-Sun spectrum for antenna , polarization , . The resulting calibration factors for antenna are determined as
To apply to some observed measurements on a particular antenna , to obtain the calibrated total power values , the calculation is:
This analysis ignores any change in gain (or attenuation) between the SOLPNTCAL measurement of the solar increment and the observed measurements to which it is applied. Gain calibration is a separate issue that will be described in another document.
1. SOLPNTCAL Pointing Calibration
This is based primarily on the scheme developed for KSRBL (Dou et al. 2009, PASP, 121, 512). The pointing offsets for all antennas can be determined simultaneously, and as a function of frequency, by offsetting each antenna in a cross pattern and measuring the total power spectrum. This provides multiple useful parameters: (i) frequency-dependent pointing offsets, which can be surprisingly large, and are necessary for primary beam corrections to all interferometer amplitudes, (ii) direct measurement of the primary beam size and shape, and (iii) a check on overall total power gain calibration relative to that determined interferometrically on cosmic sources.
This type of pointing can be done quickly (the observation takes 5 minutes for EOVSA) and is done twice daily (in case one of the observations is not successful). A special antenna control sequence (trajectory) has been implemented, which points a maximum of 5 degrees off Sun in a cross pattern. The current offset sequence in degrees is
- RAO = -5.0,-2.0,-1.0,-0.5,-0.2,-0.1, 0.0, 0.1, 0.2, 0.5, 1.0, 2.0, 5.0, 0.0, 0.0, 0.0, 0.0, 0.0, 0.0, 0.0, 0.0, 0.0, 0.0, 0.0, 0.0, 0.0
- DECO= 0.0, 0.0, 0.0, 0.0, 0.0, 0.0, 0.0, 0.0, 0.0, 0.0, 0.0, 0.0, 0.0,-5.0,-2.0,-1.0,-0.5,-0.2,-0.1, 0.0, 0.1, 0.2, 0.5, 1.0, 2.0, 5.0
where RAO must be divided by cos(Dec) to convert to a plane-of-the-sky offset.
2. RSTN Flux Density Database
The daily RSTN/Penticton flux density measurements reported by NOAA are taken at 9 frequencies, with four measurements per day at 8 frequencies from RSTN stations and three per day (generally) from Penticton at 2800 MHz (F10.7).
It should be noted that there is a new source for additional solar flux density measurements at French Space Weather Services, especially the files from late 2016 at this FTP site. These have not yet been incorporated into the scheme below, but since they include some new frequencies, it may be worthwhile to do so. --Dgary (talk) 14:26, 6 July 2017 (UTC)
Below is a typical example (missing data is flagged with -1):
2014 Nov 26
  245       24        27        24         -1         -1        20        -1
  410       44        55        50         -1         -1        51        -1
  610       70        -1        73         -1         -1        79        -1
 1415      130       131       117         -1         -1       131        -1
 2695      160       163       162         -1         -1       157        -1
 2800       -1        -1        -1        169        171        -1       171
 4995      190       191       188         -1         -1       202        -1
 8800      246       299       284         -1         -1       315        -1
15400      551       605       475         -1         -1       594        -1
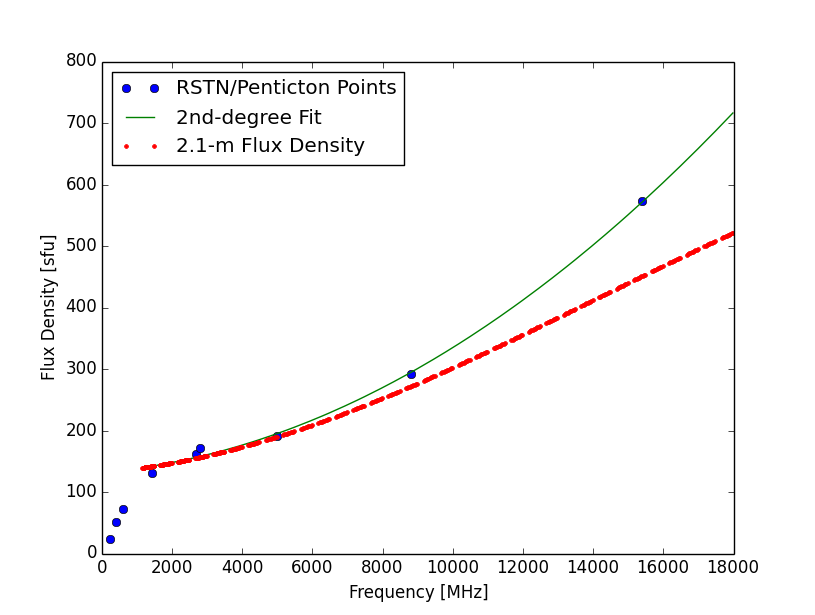
Obviously, this table cannot be completed until after a particular day’s observations are done (typically around 0300 UT on the following day), although Learmonth and San Vito data are available at the start of EOVSA’s observing day. Therefore, a real-time calibration of data must be a preliminary one based only on those two stations. The calibration should be redone overnight after more complete information has become available. Although these multiple flux density measurements could differ due to actual changes in solar flux density over the day, differences are generally small and this effect is ignored. The set of points is reduced to a single spectrum by taking the median of multiple values (where they occur). These measurements at a few discrete frequencies must then be both interpolated and extrapolated onto EOVSA’s frequencies. When such discrete frequency points are plotted, it is easy to see that points below 1.4 GHz do not follow a frequency-squared law (see blue points in Fig. 1).
Therefore, only the points above 1.4 GHz are used to define a 2nd-degree polynomial (fit shown by the green line in Fig. 1). This curve does not fit the low frequencies well in this case, being 10% too low between 2-3 GHz, and 8% too high below 2 GHz. To the extent these flux density measurements are accurate, the resulting total power calibration can be 10% off in some frequency ranges. EOVSA’s 2.1-m antennas have a finite beam size that becomes increasingly important at higher frequencies and must be corrected. This is done in an approximate sense by multiplying a uniform disk by a unit-amplitude primary beam of the theoretical, frequency-dependent size to determine the extent of dimunition of the flux density seen by the dishes. The red points (appears as a dashed line) indicate the corrected flux density. This assumes three things that are not precisely correct:
- That the solar flux density is evenly distributed over the disk (good assumption at high frequencies, but not at low frequencies where active regions can dominate);
- That the frequency-dependent primary beam is centered on the Sun;
- That the beam size is the theoretical one.
These assumptions can in principle be relaxed by using EOVSA radio images in some way (when available), and using the measured beam size and pointing offsets, but these are things to be checked to see if they make the total power spectrum substantially smoother with frequency.
Python routines for reading the flux density tables, doing the interpolation, and making the primary beam correction are available in module rstn.py.
3. Example Results from SOLPNTCAL
A given SOLPNTCAL scan is analyzed using routines in module solpnt.py. The pointing information is obtained from the stateframe data in the SQL database. The routine solpnt.get_solpnt() retrieves the stateframe information, while solpnt.process_solpnt() compares the stateframe tracking information with the original trajectory file and creates a tracking mask for isolating only data with good tracking at each pointing position. The actual Miriad data are found and extracted via routines in the dump_tsys.py module, and further processed by routines in the solpnt.py module. Once the appropriate data with good tracking has been isolated, a Gaussian fit is done for each antenna, polarization, frequency, and axis (RA or Dec) to determine the parameters , where is the solar increment above background (arbitrary units), is the offset of the peak of the Gaussian in the antenna “user units” (1/10000th of a degree), is the half-width of the Gaussian in “user units,” and is the background (off-Sun value), also in arbitrary units. Each parameter is a function of and axis (RA or Dec).
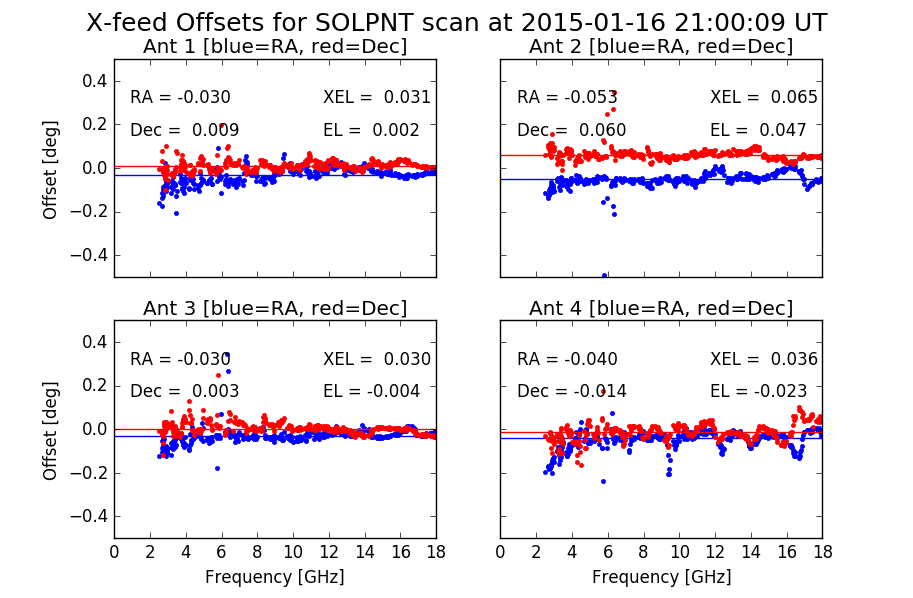
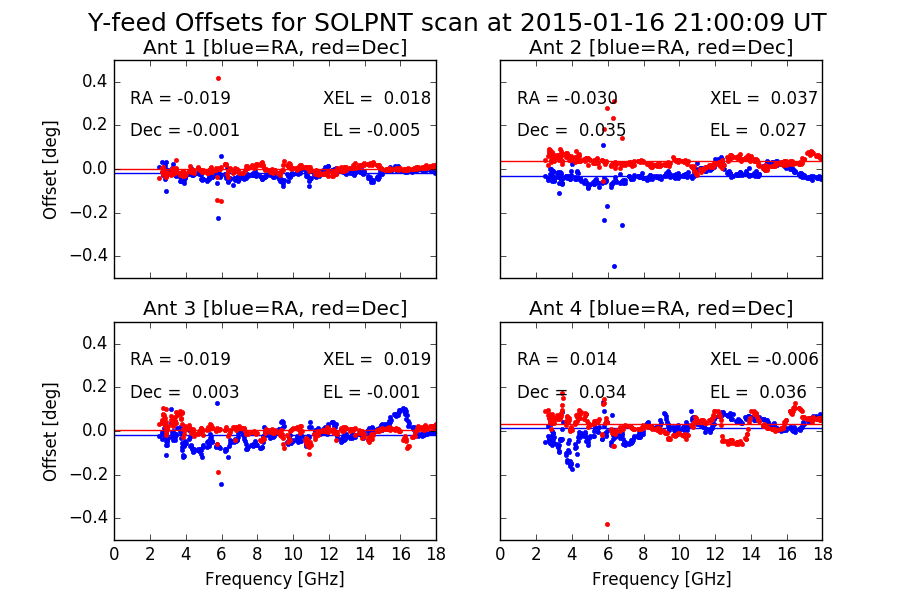
Figure 2 shows the values of RA (actually cross-Dec) and Dec offsets for the X-feed (or H-feed) for antennas 1-4 as a function of frequency, at a time when Ant 2 is not working well (damaged feed?). Figure 3 shows the same offsets for the Y-feed. The horizontal lines show the median offset for each axis and feed, also given as annotation RA and Dec. These offsets are converted to equivalent cross-elevation/elevation offsets, also annotated on each plot. The XEL/EL values can be used to update the antenna pointing parameters P1 and P7, respectively. Note that the X- and Y-feeds cannot be adjusted separately, so any pointing update must minimize the combined off-pointing of the two feeds.
It is clear from these plots that there is frequency-dependent variation of the pointing relative to Sun center. However, the feeds had not been adjusted yet for best focus (see below), so this must be done before getting too detailed about this. Obviously, the greatest concern is to have good pointing at the highest frequencies where the beam is smallest.
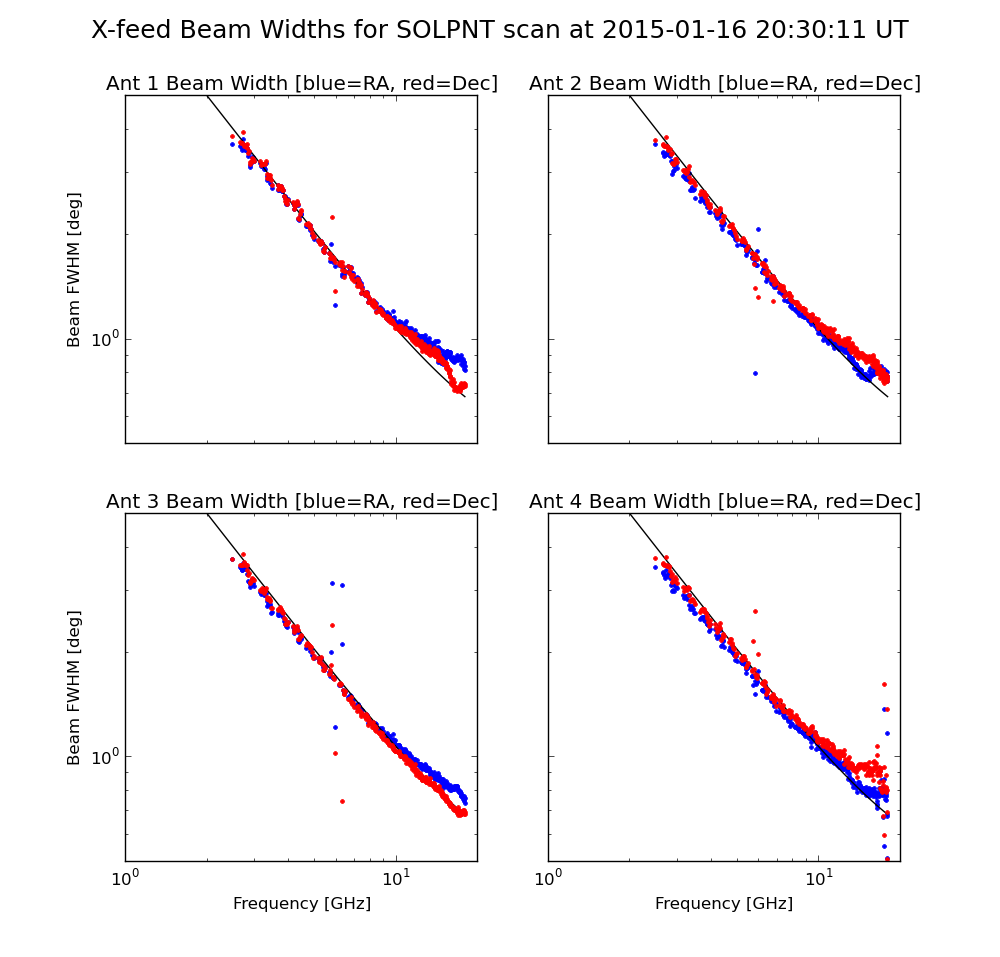
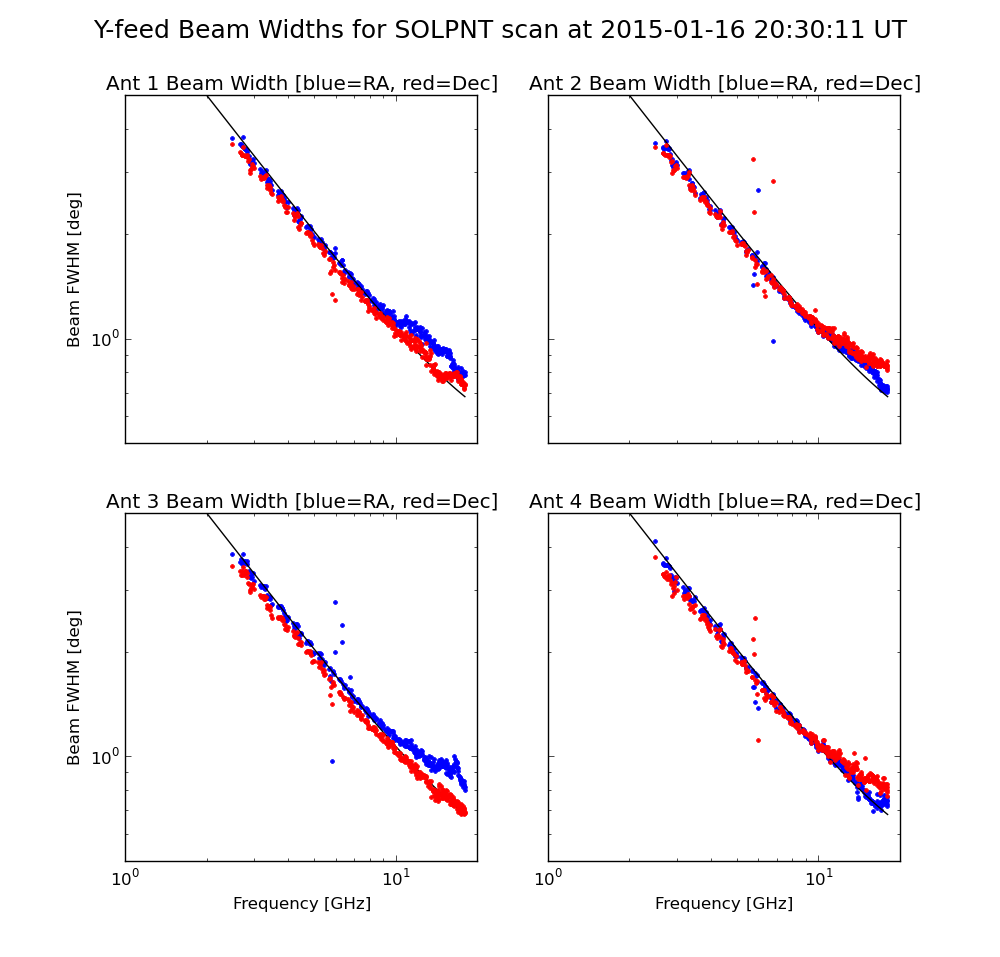
Figures 4 and 5 show the half-power beamwidth for each axis (RA and Dec) for four antennas, with Fig. 4 showing the X-feed beamwidth and Fig. 5 showing the Y-feed beamwidth. Although the Gaussian fits provide the half-widths, these have been multiplied by to convert to FWHM for this display. The black line on each plot shows the theoretical beam-width for a 2.1-m antenna, where the slight curve upwards at high frequencies is due to the finite solar disk, which becomes slightly resolved at the highest frequencies. At most frequencies, the beamsize matches expectations fairly well. Note that the two axes appear to have slightly different widths (elliptical?), and swap which axis is the narrow one (for the X feed, the RA axis is smaller, while for the Y feed the Dec axis is smaller). Because these axes rotate on the sky, the orientation no doubt changes with Azimuth. The tail-up of the beam size on antennas 1 and 4 at high frequencies is due to being out of focus. This has been adjusted and optimized.
Once the beam parameters and pointing are obtained, the total solar increment, , and background off-Sun noise, , must be gleaned from the data. In practice, the fitted values and differ for each axis (RA or Dec) due to different pointing, secular changes (especially thermal variations in receiver or backend during the measurement), and noise. For , we simply average the two values of for each . For , we can correct for pointing by considering that the effect on RA amplitude due to an offset in Dec is:
and the corresponding effect on Dec amplitude due to an offset in RA is:
where the parameters and are the fitted parameters described above, and is the corrected value. The final value for the solar increment is obtained by averaging,
Based on an actual SOLPNTCAL observation on 2014 Dec 13, the calibration factors and off-Sun background
were obtained and applied to the SOLPNT measurements (as a check on internal consistency) to obtain
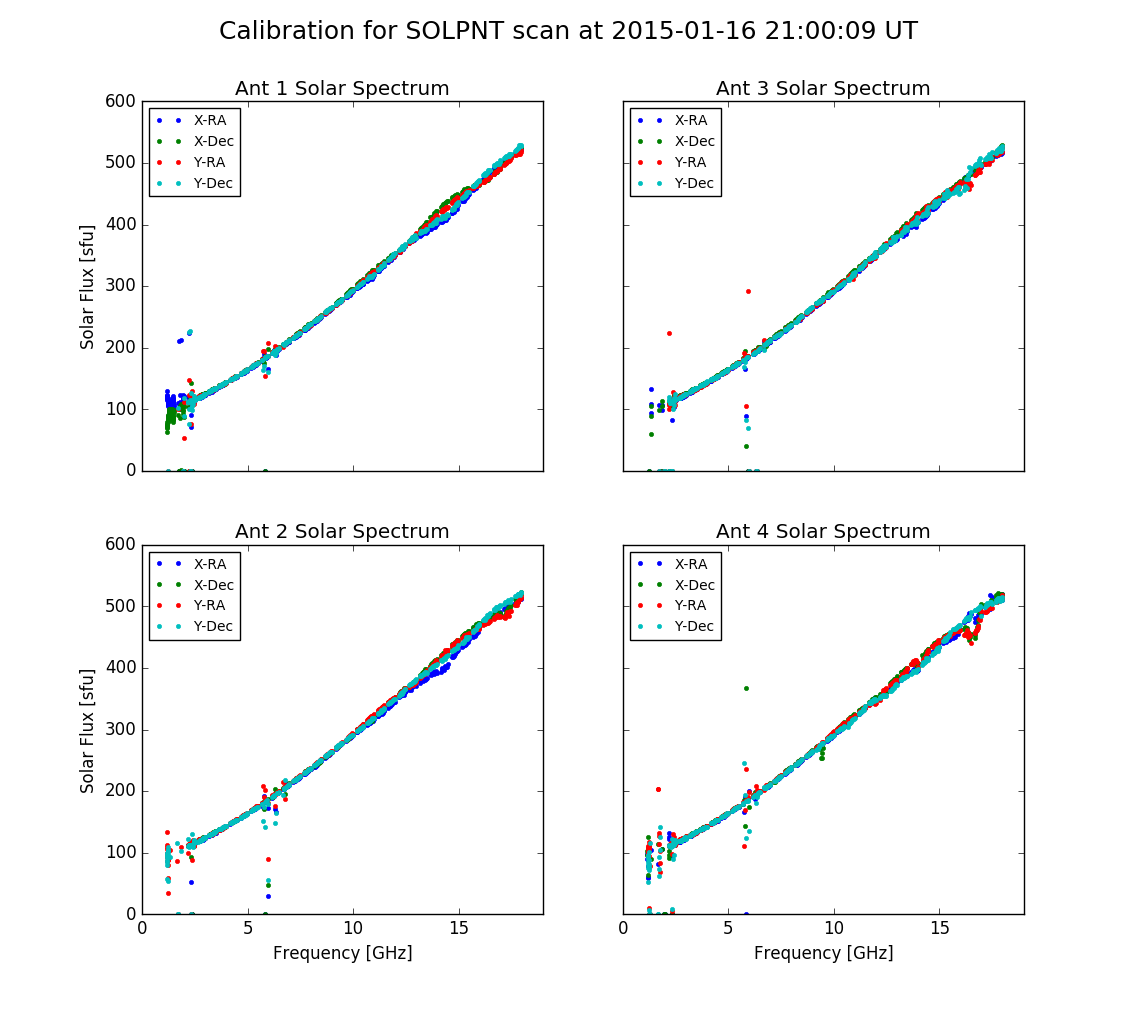
Figure 6 shows the results, where the RA and Dec differences show the extent of inconsistency between the two axes, while X and Y differences show the extent of inconsistency between the two feeds.
4. Saving and Applying the Calibration Factors
The values and must be saved in a convenient format and used to calibrate solar observations taken during the appropriate period to which they apply. So far in this discussion, no allowance for gain state has been made, and any change in state between the SOLPNTCAL scan and the solar scan to which they are applied will nullify the results. Therefore, recorded together with the calibration factors must be a full characterization of the gain state. The gain state is a function of the
- front-end attenuators (2 per polarization, fixed for all bands),
- back-end attenuator (1 per polarization, can vary with band),
- ADC attenuator in the ROACHes (1 per polarization, fixed for all bands),*
- value of FFTSHIFT in the ROACHes (fixed value for all antennas, bands, and polarizations),*
- any digital gain changes applied in the ROACH polarimetry block (varies on sub-channel level).*
\*Items marked with asterisks are not allowed to change between SOLPNTCAL scan and solar observation. Any change of these parameters requires a new SOLPNTCAL.
Obviously, clipping in the ADCs also can affect the results, but perhaps this is better considered in a list of non-linearity effects (to which non-linearity in amplifiers and optical link are to be added).
Note that only the first two are legitimately allowed to change between a SOLPNTCAL scan, so only these should need to be recorded. The data volume of the required information can be estimated from the maximum values
- (npol, nf, nants) = (2, 500, 13) for c(p,f,i) and Soff(p,f,i), = 104 kB (if stored as 4-bytes each)
- (nattn, npol, nants) = (2, 2, 13) for FEM attenuation, = 208 bytes (if stored as 4-bytes each)
- (npol, nband, nants) = (2, 34, 13) for DCM attenuation = 3536 bytes (if stored as 4-bytes each)
for a total of about 108 kB (a trivial amount). The results appear to be very stable but, as stated earlier, this calibration is done twice per day.
We need to discuss and agree on the means of keeping these daily results available with the data. Can it somehow be incorporated with the Miriad dataset, or is an external database required. If the data are automatically applied to pipeline data, perhaps it is not necessary to keep these factors with the data (although they do need to be kept available in case of problems).
5. Automatic, Pipeline Calibration
The calibration procedure has been automated to run as a cron job. The crontab entry for it that runs on Pipeline is:
1,6,11,16,21,26,31,36,41,46,51,56 17,18,19,20,21,22,23 * * * touch /data1/TPCAL/LOG/TPC$
(date +\%Y\%m\%d).log; /usr/bin/python /common/python/current/calibration.py >>
/data1/TPCAL/LOG/TPC$(date +\%Y\%m\%d).log 2>&1
This runs every 5 minutes between 1701 and 2356 UT. The touch command creates a log file for a new day, if it does not exist, in /data1/TPCAL/LOG, then runs the calibration.py routine, which puts the output as a binary file into /data1/TPCAL and appends any messages to the log file. These output files have a standard name TPCALyyyymmdd_a_b_c.dat, where a is the number of polarizations, b is the number of frequencies (can be two or three digits), and c is the number of antennas. The calibration file is written by sp_write_calfac() and can be read by sp_read_calfac(); both routines are in the calibration.py module. The values of a, b, and c in the filename must be accurate for the reading of the binary data to work. In addition to running as a cron job, the calibration can be run by hand by entering in a terminal a command like:
python /common/python/current/calibration.py ‘2015-01-02 21:36:00’
where the date and time are at least 5 minutes after the start of a SOLPNTCAL calibration, but no more than 10 minutes after. This example is for a SOLPNTCAL scan that started at 21:30:00 UT on Jan. 2.
There is also a corresponding cron job that runs on the dpp to create similar calibration files there (also in the dpp’s /data1/TPCAL directory. The difference is that the ones on Pipeline create the calibration based on text files already dumped from Miriad by the Pipeline process, and stored in subdirectories of /data1/UBDTEXT, which have 45 frequencies. These are suitable for applying the calibration to the UDB files and the fits files created from them by the Pipeline. In contrast, the ones on the dpp are dumped explicitly by the Python code by running varplt on the IDB files, and then processed to provide the full frequency resolution (445 frequencies). These are suitable for applying the calibration to the IDB files.
The calibration files on Pipeline are read via the IDL routine that creates the real-time fits files, hence the data in the fits files are now automatically fully calibrated, with the huge proviso mentioned above that this only works when the solar data and the SOLPNTCAL data are taken with the same attenuation settings. Ultimately, the gain information has to be saved with the calibration factor data, and corrections have to be automatically applied.
This scheme has been running very well, and has proven to be quite reliable. In addition, when the calibrations from different dates are compared they are also very consistent, so it may be that the calibration is not needed every day, and certainly not twice a day. However, I have been doing the observations twice a day because sometimes something will go wrong with one of the SOLPNTCAL observations. In these cases, a quality control check is done and if too many antennas/polarizations (half or more) fail the calibration is not updated.
6. Manually Applying the Calibration
As noted, the calibration is applied automatically on Pipeline, so that the fits files on the web page are already calibrated. However, these files have only 45 frequencies whereas the IDB files have 10 times as many frequencies. Hence, to study a flare, one is likely to want to start with the IDB files. Routines have been written in python modules tp_display.py and offline.py to help to dump IDB total power data, apply the calibration, and display the results in a nice plot. The tp_display.py routines are used when one is logged on to the dpp and has direct access to the IDB files. The offline.py routines are used when one is working on another machine and instead relies on already having the output (xt*.txt and yt*.txt files) dumped by the Miriad varplt routine. I admit that this is mainly so that I can work from my laptop on an airplane. In both modules, one starts with the rd_tsys_multi routine (i.e. tp_display.rd_tsys_multi() if on the dpp, and offline.rd_tsys_multi if offline, but the appropriate *.txt files have been previously dumped. The output of these routines is the same, a python dictionary called “out.” To calibrate, one must also have a copy of the appropriate calibration binary (TPCAL) file available.
The sequence of calls to read, calibrate, background-subtract, and display a total power dynamic spectrum for 2015 Jan 01 between 1700 and 1800 UT is:
import tp_display, offline
import numpy as np
from util import datime
d1 = datime()
d2 = datime()
d1.set(‘2015-01-01 17:00:00’,’str’)
d2.set(‘2015-01-01 18:00:00’,’str’)
out = tp_display.rd_tsys_multi(d1,d2)
fghz, calfac, offsun = offline.read_calfac(d1)
out = offline.apply_cal(out, fghz, calfac, offsun)
idx = np.arange(100,200)  # Uses indexes 100-200 to develop background for sub.
out = offline.bg_subtract(out, idx)
offline.tsys_show_dynspec(out)
The last line creates the dynamic spectrum plot. One also has access to the data themselves within the Python dictionary “out,” whose keys are:
- ‘fghz’ (the list of frequencies in GHz),
- ‘ut’ (the list of UT times/dates as LabVIEW timestamps—use d1.set(out[‘ut’][0],’tstamp’), then d1.get(‘str’), to translate such a timestamp, or simply out[‘ut’] % 86400 to convert to seconds of the day),
- ‘xtsys’ and ‘ytsys’—the actual data for X and Y polarizations, with shape (nt, nf, nant).


![{\displaystyle c(p,f,i)=s(f)/[S_{on}(p,f,i)-S_{off}(p,f,i)]}](https://wikimedia.org/api/rest_v1/media/math/render/svg/7652a61a785c7cc7ba37086ed28bde946af3ffb4)


![{\displaystyle T(p,f,i)=[o(p,f,i)-S_{off}(p,f,i)]\times c(p,f,i)}](https://wikimedia.org/api/rest_v1/media/math/render/svg/50f40e76f5bf760687971f2febece3648631a2f5)
