Owen's Notes: Difference between revisions
| Line 374: | Line 374: | ||
[[File:eovsa_browser_nodata.png|none|The 'No Data' errors on the EOVA browser page.]] | [[File:eovsa_browser_nodata.png|none|The 'No Data' errors on the EOVA browser page.]] | ||
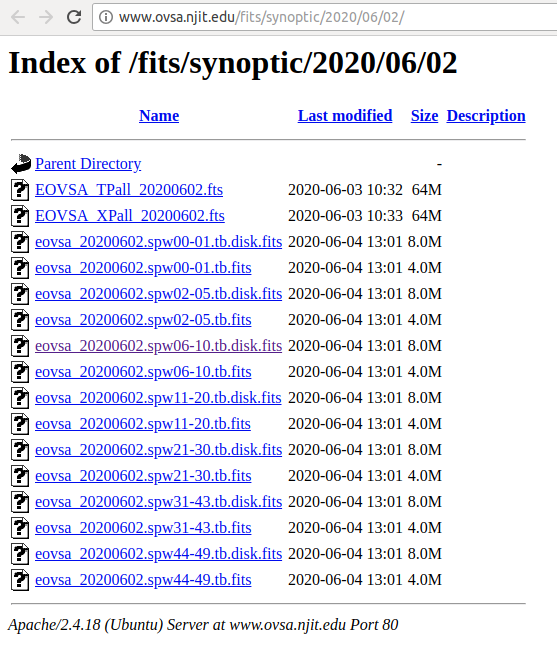
Clicking on the Newest button will refresh the page and upload the latest data. If this does not correct the problem take a note of the date in the web address of the page. Then click on 'Today's Data'. I list of fits files should appear as below: | |||
[[File:eovsa_browser_files.png|none|Example list of files if pipeline processing was successful.]] | |||
The log files will need to be inspected in order to dermine what went wrong. | |||
Note: I am in the process of updating scripts, so the diagnostic procedure is not complete - OG | |||
Revision as of 17:17, 4 June 2020
Routine Tasks
Daily Tasks
Check the following pages:
http://ovsa.njit.edu/status.php (the all-day plot from the previous day is at the bottom of the page)
http://www.ovsa.njit.edu/browser/ (this defaults to showing pipeline output from two days previous)
http://ovsa.njit.edu/pointing/ (the latest pointing plot(s) at the bottom)
http://ovsa.njit.edu/phasecal/ (the latest phasecal vs. frequency is somewhere in the middle, i.e. the bottom of the list of pcf*.png files).
http://ovsa.njit.edu/EOVSA/ant_status.php (Current antenna status).
Perform a Phase Calibration
Check that the network monitoring function (fix_packets()) is working on the DPP. It can also be seen as dropouts on the spectrogram (http://ovsa.njit.edu/status.php).
If there are any problems with any of the antennas goto http://ovsa.njit.edu/EOVSA/ant_status/ant_status_form.php and fill out the appropriate form.
Weekly Tasks
Perform a Gain Calibration
Monthly Tasks
Perform a Pointing Calibration
Remote Login (23 March 2020)
Helios Login
The computers can be accessed remotely using SSH and VNC. Since I use Linux (Ubuntu) these instruction are for that OS.
To VNC into Helios, open a terminal and type the following command:
ssh -L 5902:helios.solar.pvt:20000 oweng@ovsa.njit.edu
I then open Remmina Remote Desktop Client. Make sure VNC is selected at the top left. Type in:
localhost:2
and enter the password when prompted.
The Helios display should now be visible.
Occasionally, the VNC connection will be lost. If this occurs the following procedure need to be performed.
From a new terminal window type:
ssh -L 8887:helios.solar.pvt:22 oweng@ovsa.njit.edu
From another terminal issue the command:
ssh -p 8887 sched@localhost
Now type in:
x11go
Now restart the VNC client.
Pipeline login
To log in to pipeline, from a terminal enter the command:
ssh -L 8888:pipeline.solar.pvt:22 oweng@ovsa.njit.edu
Then from a new terminal enter:
ssh -p 8888 user@localhost
Win1 login
To log in to the win1 machine, from a terminal enter the command:
ssh -L 8889:win1.solar.pvt:5900 oweng@ovsa.njit.edu
Then from a new VPN client enter the hostname:
localhost:8889
Phase Calibrations (23 March 2020)
Phase calibrations are to be performed every day when possible.
Reference Calibration
Before the phase calibration can be done, a reference calibration needs to e performed, which will be subsequently used as the reference for the phase calibration.
Access the Helios computer.
On the terminal window make sure that the ipython: /home/user tab is selected.
There should be a prompt as follows: pipeline:~>
At the prompt type the following command:
python /common/python/current/calwidget.py
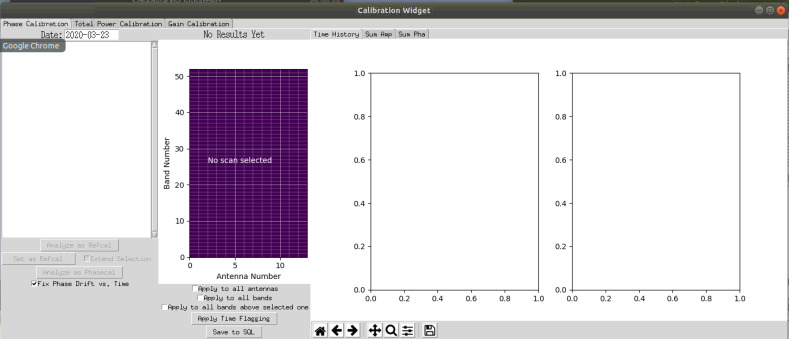
The following window will open up:
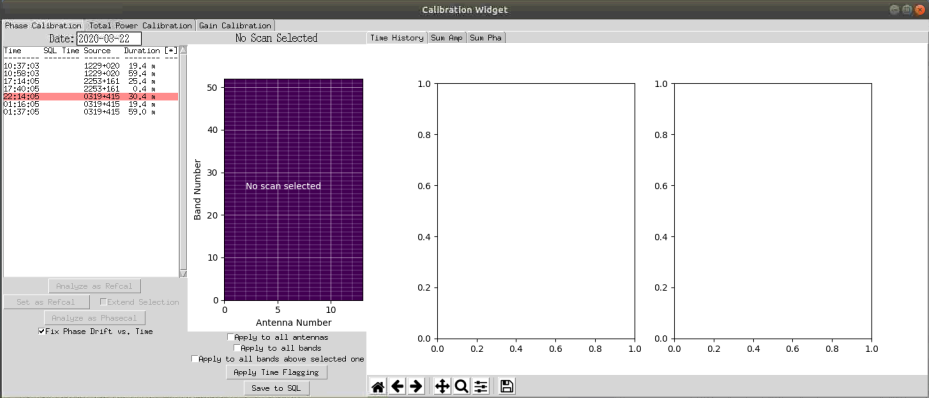
In the date box near top right of the window type in or use the up and down arrows to select the previous days date and hit enter.
Click on the first available scan that does not suffer from a Windscram. Windscrams are marked in red. If a windscram occurred for less than 20% of the scan then it will be marked in yellow and may still be usable. The example below shows a windscram at 22:14:05.
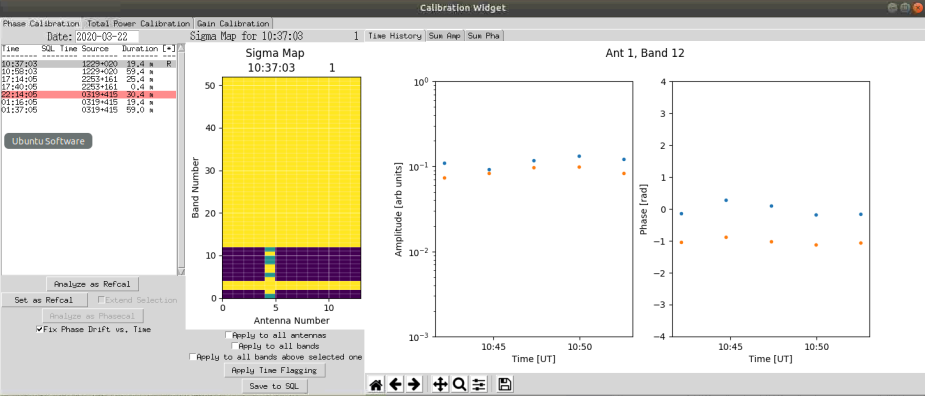
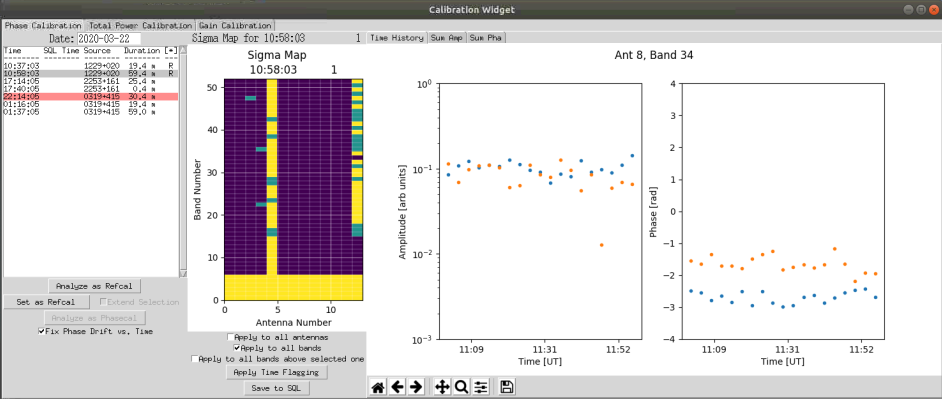
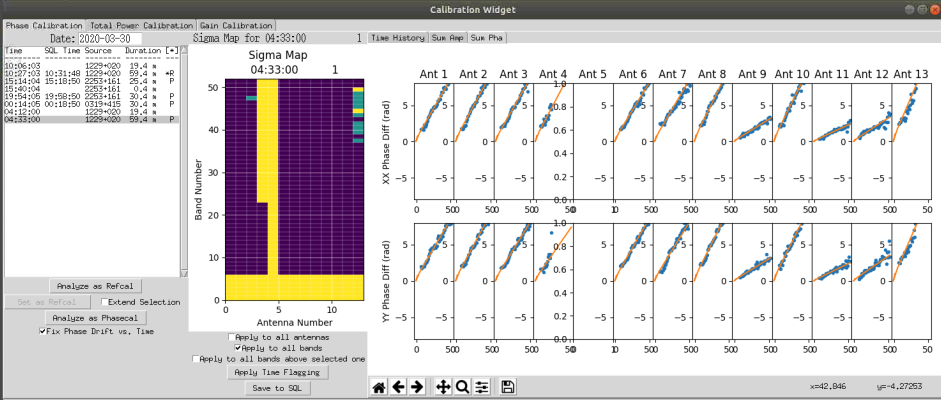
Select the earliest calibration that does not have a windscram, and then click on 'Analyze as Refcal'. The Sigma map should now be populated as shown below:
The above chart is for the low-band (channels 1 to 12). Yellow blocks indicate bad or unavailable data. Bands 3 and 4 are excluded due to intense RFI at these frequencies. Antenna 5 currently is not operating well, and will be excluded from any analysis. The green blocks indicate that the data may be alright if some points are excluded. Purple blocks indicate the data is good.
Also shown in the above plot is the power and phase for Antenna 1 and band 12. The blue points are the X-polarization and the orange points are the Y-polarization. These should be close to straight lines.
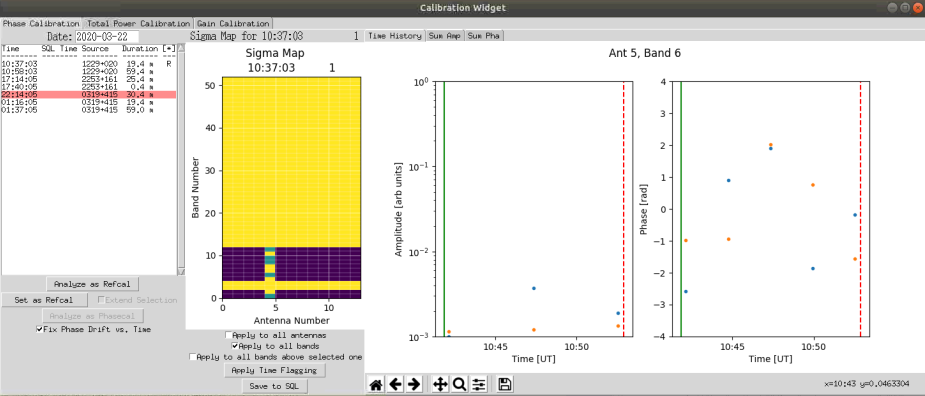
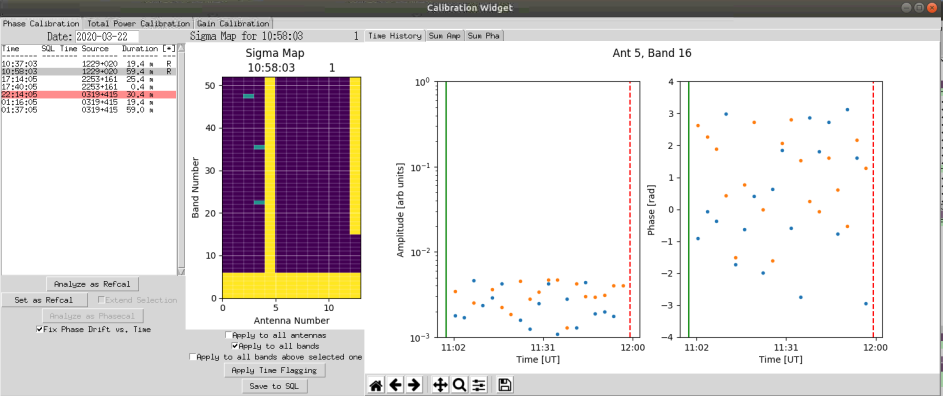
In this case we need to exclude all of Antenna 5 from the calibration. First click on any block for antenna 5 in the range of band 1 to 12. Next check the box 'Apply to all bands'. Move the mouse over to either the Power or Phase plots (either works). We need to exclude all points. Move the mouse slightly before the first point in the chosen plot and press the 'A' key. A green line will appear. next move the mouse slightly past the last point and press the 'B' key. A red line will appear. The screen should look like the figure below.
Now click on 'Apply time flagging. All of antenna 5's bands should turn yellow.
Once complete, select the associated high band calibration and then click on 'Analyse as refcal'. In this case bands 7 to 52 will be shown on the sigma map as shown in the figure below.
Antenna 5 once again needs to be excluded using the procedure described above. In addition antenna 13 has problems from band 13 to 52. We will remove these channels from the analysis. Ensure 'Apply to all bands is unchecked and select 'Apply to all bands above selected one'. Select band 13. As before select all of the points by pressing 'a' and 'b' at the appropriate points (start and end of the plot). Click on 'Apply Time Flagging'. All of the bands from the selected band up should turn yellow as shown in the figure below.
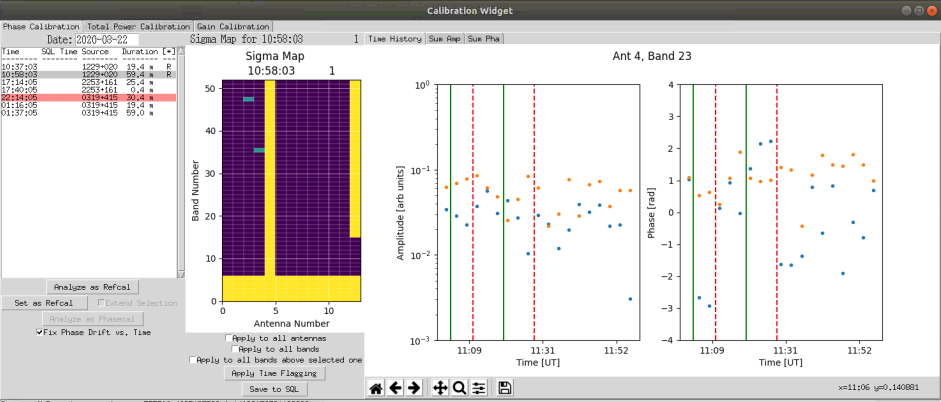
As can be seen, there are still 3 green squares. We can make these good by selecting each one and flagging bad samples. In this example I have selected Antenna 4, Band 23.
Ensure all checkboxes are unchecked. Slelect the box for the antenna and band the you wish to time flag. select (using mouse and a and b keys) up to two ranges of points to exclude. pressing the x key will remove the most resent line chosen. Once you have flagged the ranges, click on 'Apply Time Flagging'. Hopefully the box will turn purple. If not you may need to select different ranges.
The result of this procedure is shown below.
Repeat this procedure for the remaining bad antennas and bands.
Once completed, select one of the bands of the refcals from list on the left and then click on 'Set as Refcal'. The click on extend selection. NOw select the other refcal. Make sure both are highlighted. Click on 'Set as extended refcal'. Click on 'Save to SQL'.
Phase Calibration
After the reference calibration has been done, the phase calibration can be performed. Click on a good calibration for the high band (one that has not had a windscram and has a reasonable duration). Not that Phase Cals are not performed using the low band.
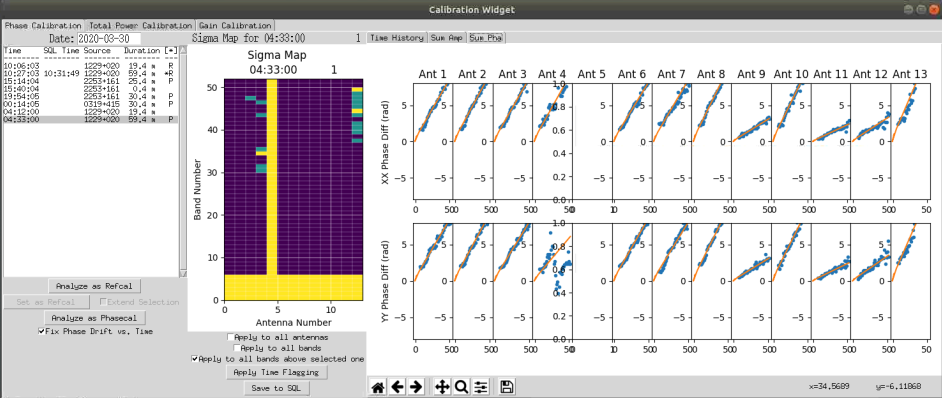
Then click on 'Analyze as Phasecal'. At the top of the screen click on the 'Sum Pha' tab. The important thing here is that the slopes look good. Below is an example display of the slopes. These slopes are with reference to the Refcal.
In the above display, we can see that all of the slopes look good except for Antenna 4. note that we have excluded Antenna 5 from the observations as these have no reference cal. By moving the mouse over points on antenna 4 the channel is displayed as the x value in the bottom right of the window. In this case, channel 24 and above will be excluded. Ensure 'Apply to all bands above selected one' is checked and click on the antenna 4 and channel 24 box. Select all points and click on 'Apply time flagging' Once done, click on the 'Sum Pha' tab again to ensure the slope now looks okay (See figure below). Once satisfied click on 'Save to SQL'.
System Gain Calibration (30 April 2020)
This procedure is designed to adjust the system gains. This should be performed weekly or whenever the calibrations become poor. The full details can be found at EOVSA System Gain Calibration. The steps below are a summary of that page.
The best time to perform this calibration is immediately after a Solar Point Calibration, as the antennas need to be taken off the sun.
The dBm values in the power and attenuation section of the Stateframe display should be between 1 and 4.
Initially click on the Stop button in the schedule window.
From the Schedule window issue the following commands:
$scan-stop
stow
femauto-off
femattn 0
$fem-init
Wait approximately 30s for the new settings to update. Then proceed with:
dcmauto-off
$capture-1s dcm
Click on the Clear button and then the Go button.
From a pipeline terminal issue the following commands
ipython --pylab
import roachcal
tbl=roachcal.DCM_calnew('/dppdata/PRT/PRTyyyymmddhhmmssdcm.dat',dcmattn=10,missing='ant15')
In the above command yyyymmddhhmmss is the year, month, day, hour minute and second of the dcm file. Pressing tab will complete the filename. for the missing field, antenna 15 must be included. Add any other antennas that are not to be included on the gain calibration separated by spaces.
Enter
tbl
to view the contents of the tbl variable that was just created.
Band 1 has recently had bad attenuations. To use older good values for this band issue the command:
tbl = roachcal.override(tbl, bandlist=[1])
Other bands can be excluded by adding the bands to the bandlist (space separated).
Finally:
import cal_header
cal_header.dcm_master_tablesql(tbl)
From the Schedule window click the Stop button and then the Go button.
Update Antenna Pointing (17 March 2020)
Access the Pipeline Computer.
From the terminal, start ipython:
ipython --pylab
Import the calibration and Time libraries:
import calibration as cal
from util import Time
Load up the solar pointing scans for a given date and time.
x,y,qual=cal.solpntanal(Time('2020-03-17 18:30'))
The above command will load the scans from the 17 March 2020 18:30 UT.
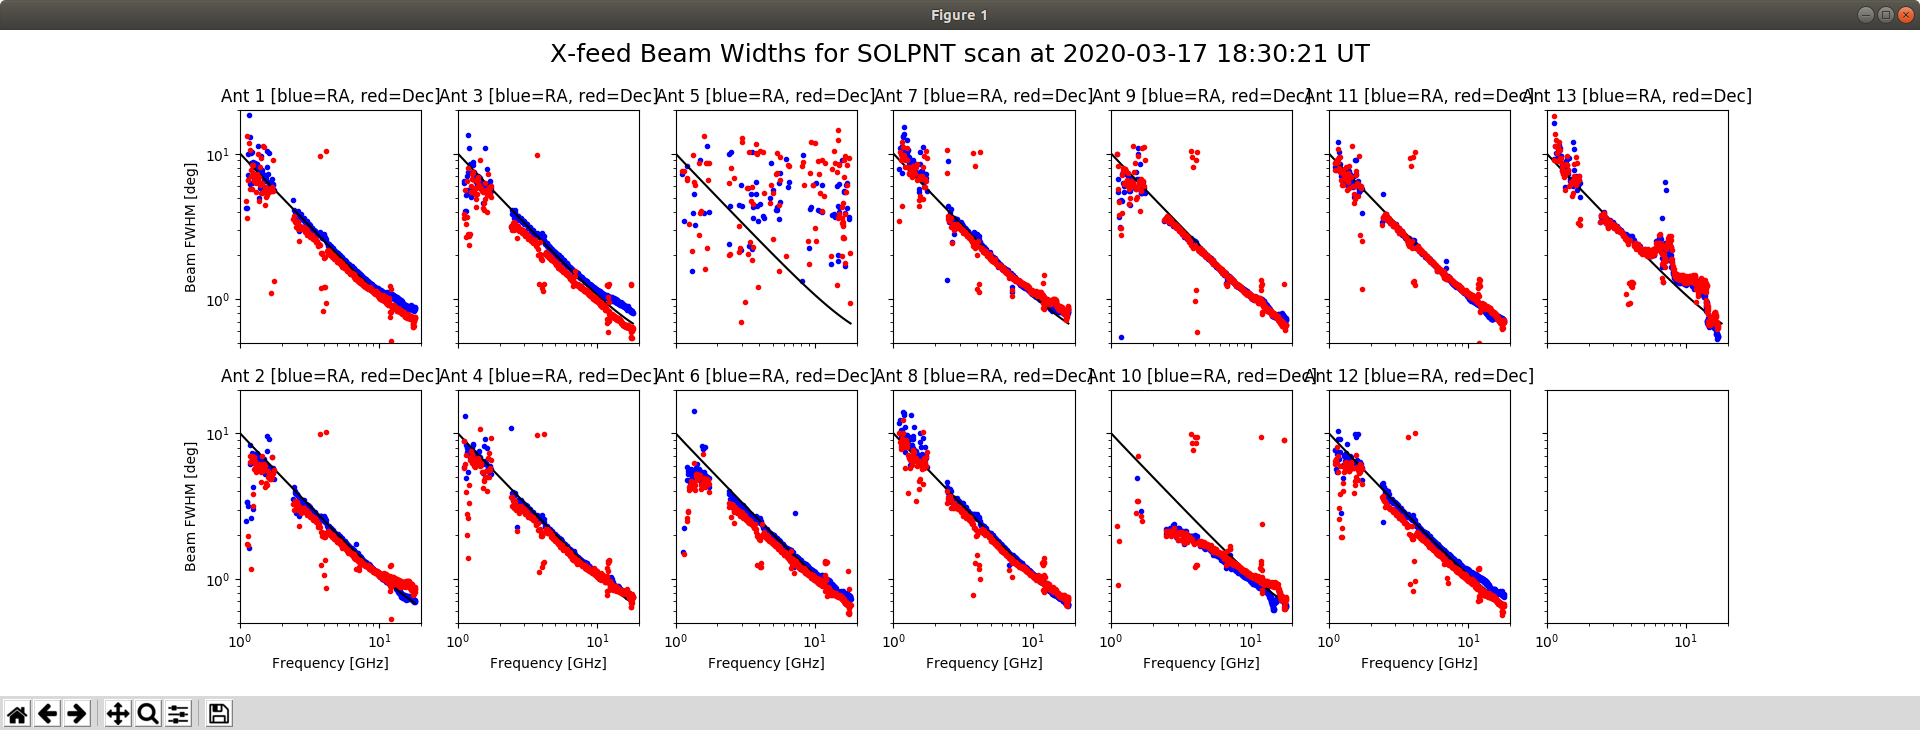
To view the beam widths as a function of frequency for each antenna and polarisation:
cal.sp_bsize(x,y)
To obtain the pointing offsets:
xoff,yoff,dx,dy=cal.sp_offsets(x,y)
This will display the offsets for each antenna and feed. Ideally the offsets should be at zero. If particular antennas significantly deviate from zero then a correction can be made.
For example, the following command will adjust the pointing offsets for antennas 6 to 8, 10 and 13:
cal.offsets2ants(Time('2020-03-17 18:30'),xoff,yoff,antst='ant6 ant7 ant8 ant10 ant13')
The newer antennas with the alt-az drives that have had tracking updated will need to be rebooted. From the Schedule Window issue the commands:
reboot 1 ant6-8
tracktable sun_tab.radec 1 ant6-8
track ant6-8
The antenna pointing adjustment is typically performed once per month.
Helios Displays
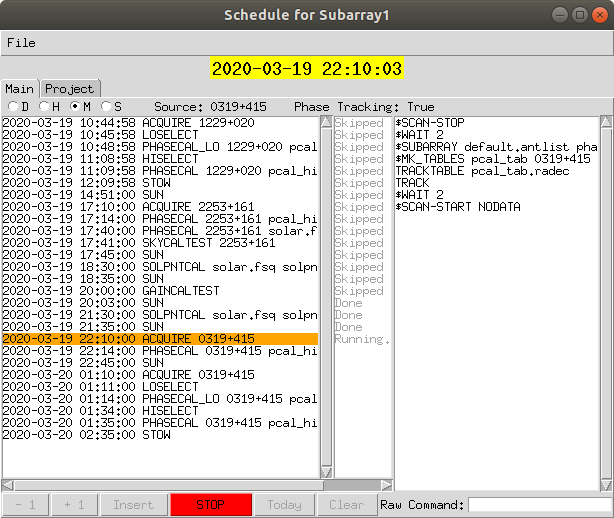
The Schedule window shows the currently running schedule as shown below.
The left side of the window shows each of the scripts that is to be run. The orange bar shows the task that is currently being run.
The right side of the window shows each command that is to be run in the current script.
At the bottom of the window are a series of buttons. The STOP button will stop at the current script. Once stopped, the remaining buttons will become active.
Antenna Trouble Shooting (2 April 2020)
If an antenna in the State-frame Antenna Tracking section is highlighted red, it will need to be restarted.
In the state-frame display, click on the antenna display and then click on the tab for the appropriate antenna.
One or both of the Permit boxes will probably be red. The left column is for azimuth and the center column is for elevation. The procedure for Az and El is slightly different.
Access the windows computer.
Click on then Quick launch icon at bottom right and then click on the antenna that is problematic.
Click the Enable checkbox. The Drives On, Operate, Energized and Break off should all be green.
If the Permit lights are red the click Reboot System.
The current time should be updating about every second (there may be brief pauses).
Click Exit.
If the Elevation Permit fails to become green then access the following page (make sure to replace vik5 with the appropriate antenna):
Turn the Antenna Relay on and wait for 10 seconds.
Turn the Relay off.
If the antenna still will not start goto the following webpage (make sure to replace ant5 with the appropriate antenna):
Click Login and then enter the username and password.
Click Parameters and the change Option 10.00 to 1070 and Option 10.38 to 100. Click on change.
Then click on logout.
After the above procedures are completed you will need to reload the track table. This is done from the State Frame display using the following commands (again ensure that ant5 is replaced with the appropriate antenna):
tracktable pcal_tab.radec ant5
track ant5
Antenna Communications Failure
If an antenna is highlighted in the Communications section of the State-Frame display then the following procedure can be used to correct it.
Access the win1 computer.
Click on Start then select NI Max. Goto Remote Settings and then select the CRIO that is not communicating.
Click the System Settings tab at the bottom of the window. Status should be running.
Click on Refresh to reconnect.
The CRIO will have an IP address in the range of 192.168.24.41 to 192.168.24.53. If it is not working this IP address will be strange. Click restart.
If it is not already open, Click Programs then NI Labview 2015.
Other Issues
Temperature Controller (30 Apr 2020)
Occassionally a front end temperature will show an error. This is usually because the temperature controller that reports the temperature has locked up. To fix this type the following command in the Schedule window:
tec$bc ant5
Replace ant5 with the antenna(s) that need the temperature controller rebooted.
To clear the temperature history (that updates every minute) issue the command:
tec$sc ant5
Packet Loss on DPP
If the packet monitoring program on the DPP computer shows lines similar to:
2020-05-28 15:43:42.001 0.0 0.0
then data packets are being lost. To fix this problem follow the following steps:
- Terminate the fix_packets() program by pressing [CTRL] C.
- Type !nano </home/user/test_svn/shell_scripts/SMP_AFFINITY.sh>
- Comment out the current cpu's and uncomment the following ones.
- Restart the fix_packets() program.
- Exit nano and save the file.
Occasionally the glitch will occur after the above procedure has been performed. In this case the DPP will need to be rebooted. The procedure to do that is as follows:
- Terminate the fix_packets() program and exit ipython by typing exit
- Enter the command sudo reboot now and wait about 5 minutes.
- Log back into the DPP by typing ssh -X user@dpp
- Enter the command /home/user/test_svn/shell_scripts/AMP_AFFINITY.sh
- Enter the command rmlock. This will remove the lock file.
- Start ipython by typing ipython --pylab
- Restart the fix_packets() program.
Restarting the Schedule
If the schedule needs to be restarted then follow the steps below:
- Click Stop and then Clear.
- Click Today and then Go.
Pipeline Problems
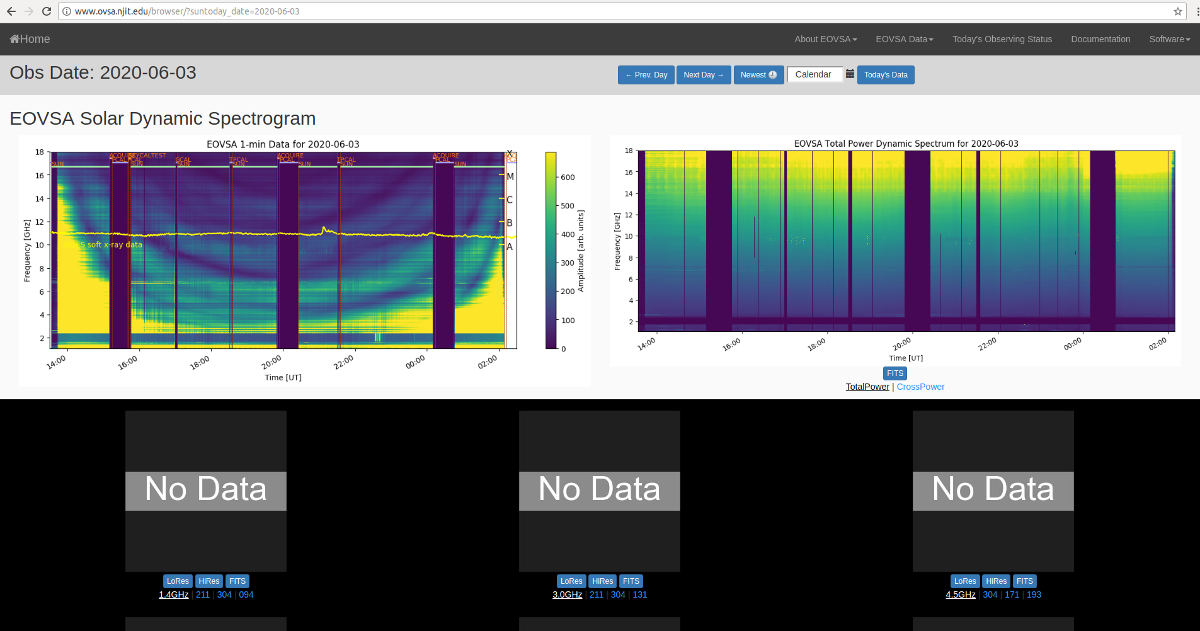
If there is no data showing at http://www.ovsa.njit.edu/browser/ then something has gone wrong with the pipeline processing. Below is a image of what the webpage looks like when an error has occurred.
Clicking on the Newest button will refresh the page and upload the latest data. If this does not correct the problem take a note of the date in the web address of the page. Then click on 'Today's Data'. I list of fits files should appear as below:
The log files will need to be inspected in order to dermine what went wrong.
Note: I am in the process of updating scripts, so the diagnostic procedure is not complete - OG
