Trouble Shooting Guide
This is a trouble shooting guide for tohbans monitoring EOVSA remotely using MobaXterm and VNC Viewer.
<General checklist for solar observation>
1. Check Antenna Status Page to see if any antenna is under work
2. In Schedule window, click "Today", "File", choose "Save" (overwrite if prompted), and "Go".
3. Antenna on track or not
4. Frequency Tuning: "Sweeping" & Phase Tracking: "ON"
5. Attenuation values
6. Temperature plot
7. Check if CryoRX tab's FEMA Outlets & Receiver Voltages/Current/Status are all ON & nonzero (top half)
8. hpol & vpol plots (Savelist)
9. Make sure that EOVSA Observing Status Page is being updated
10. STOW antennas at the end of the observation, if needed
Schedule window
I accidentally closed the schedule
1. Click "Schedule" (on the left task bar) just once.
2. Click "Today".
“Error: Could not write stateframe to SQL”
1. hit STOP on the schedule
2. type $scan-stop in Raw Command window (to stop the data recording)
3. close the schedule (exit out of it)
4. restart the program (by clicking on the icon at the left)
5. hit GO to start the observation again
Stateframe
“ACC down?”
1. Open pdudigital.solar.pvt on web browser
2. Go to “Actions”
3. Go to “Loads” (on the left)
4. Click item 14 (ACC)
5. Hit “Cycle” and “Ok” when prompted
After rebooting, if Stateframe hangs up & does not respond, open a new Stateframe and give "kill ##" (## = “My PID” on the upper right corner of frozen Stateframe) command to sched@helios.solar.pvt server.
CryoRX tab - Status are OFF, all values are zeroes (Checklist #7 is false)
What you should be seeing is that FEMA Outlets and Receiver Voltages/Currents are all zeroes, and Status are all OFF (except for Noise Diode, and RFSwitch when using low frequency receiver). This means that the control system for receiver has died. You would still see that antennas are tracking fine and data is recorded, and it doesn't mean that these data are "wrong" or "unusable". They have to be ON and non-zeroes whenever you want to change receiver setting or modify attenuation setting, which sometimes happens during the observation.
To reboot, execute "starburstControl start" in antctl@feanta server (ssh connect from helios, if disconnected).
<12/18/2016> To reboot, just type "ctlgo" in a terminal window on helios (in VNC Viewer). If for any reason you want to stop the control system, type "ctlstop".
Antenna(s) down
Don’t forget to check the Antenna Status page before considering to “fix” any of the antennas!!
Symptoms: Not tracking, showing ‘AT STOW’ or other unwanted coordinates, both AZ and EL permits ON or only EL permit ON, or Axis Lock is ON
1. Ant 9, 10, 11, 13 could be in this state early in the schedule because they just can't move to commanded position (out of declination limit). In this case, you just have to wait a while (~few hours?)
2. In cold morning, large spike in the current may cause large position error in AT STOW state.
3. Proceed if neither #1 nor #2 is the case. If only AZ permit is ON (the first column), try "reboot 1 ant2" for rebooting ant2, for example.
4. If both AZ and EL permit is ON (the second column) or only EL permit is ON, then give command "$pcycle ant2" for resetting antenna 2. This switches OFF the power to antenna for 15 seconds and switches ON. In Communication tab, Ant 2 line will go red. Wait till it becomes white. If it does not become white, then try "sync ant2". If cRIO does not respond to this, it may be in “safe mode”, in which case you can type "$pcycle crio ant2" (if on ants 1-8 or 12) and it will cycle the power on the cRIO. Note that cRIO takes at least 2 minutes to reboot and come back online. If this sequence does not work, you may try $pcycle again, but keep in mind that this command in general should only be used when needed (i.e. discouraged if it can be avoided), to save wear and tear on the components.
5. Give "tracktable [the current tracktable ***.radec] ant2" and "track ant2" to initiate the tracking. If this does not work, look for temperature to raise (if temperature is low).
BRIGHTSCRAM
Find out which antenna is experiencing this by looking at FITS image files. BRIGHTSCRAM should appear as data-gap like features on the dynamics spectra. If more than two antennas are having BRIGHTSCRAM, then ALL antennas show BRIGHTSCRAM.
Wait for a while (~10 min) to see if it automatically goes away. After it goes away, give "tracktable [the current tracktable ***.radec] ant#" and "track ant#" to initiate the tracking.
Frequency Tuning's Sweep Status is “stopped”
1. Try "Stop" and "Go" the schedule.
2. If #1 does not work, try "loa1-reboot" in Raw command window
3. If #2 does not work, try the following raw commands:
fseq-off
fseq-init
fseq-file [the current frequency receiver setting ***.fsq]
fseq-on
Temperature is fluctuating too much
Try rebooting the temperature controller by typing "tec$bc ant2" for ant2, for example (tec => Thermo-Electric Controller).
nd-on is on (Attenuation)
Send "nd-off ant#" raw command to turn off the local noise diode.
hpol/vpol plot (Savelist) is showing unusual oscillating behavior
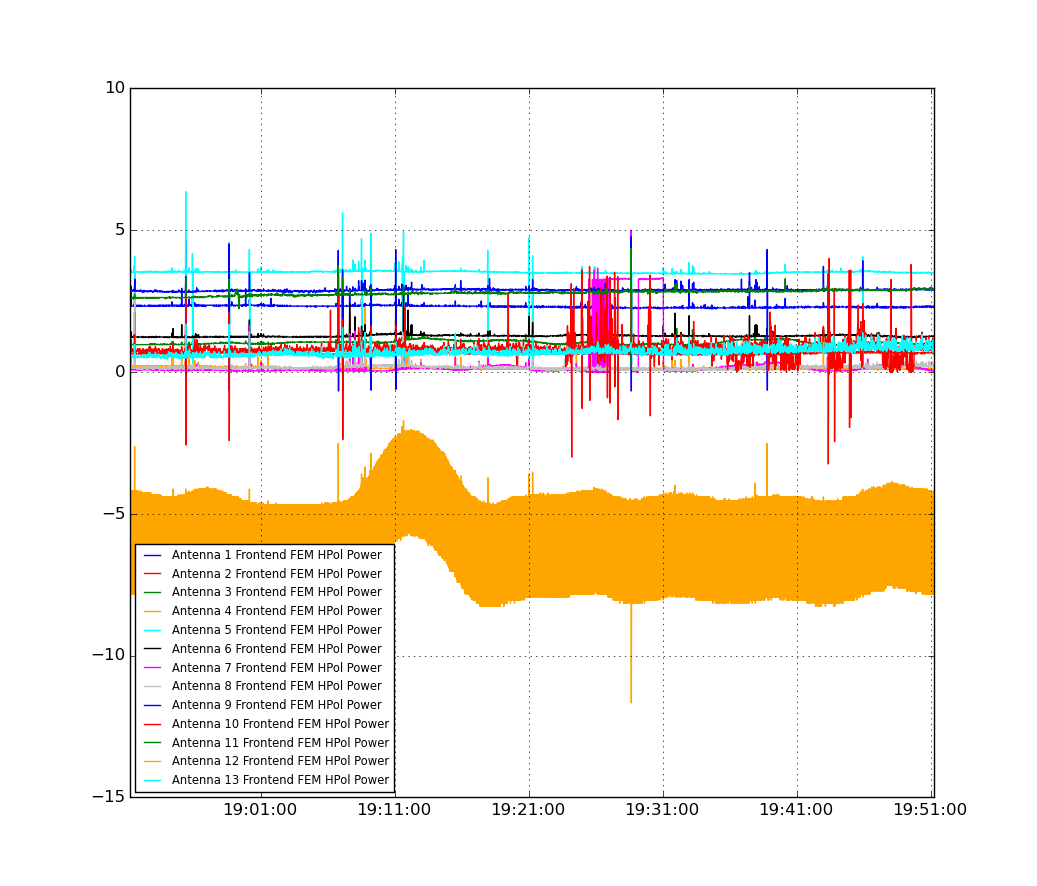
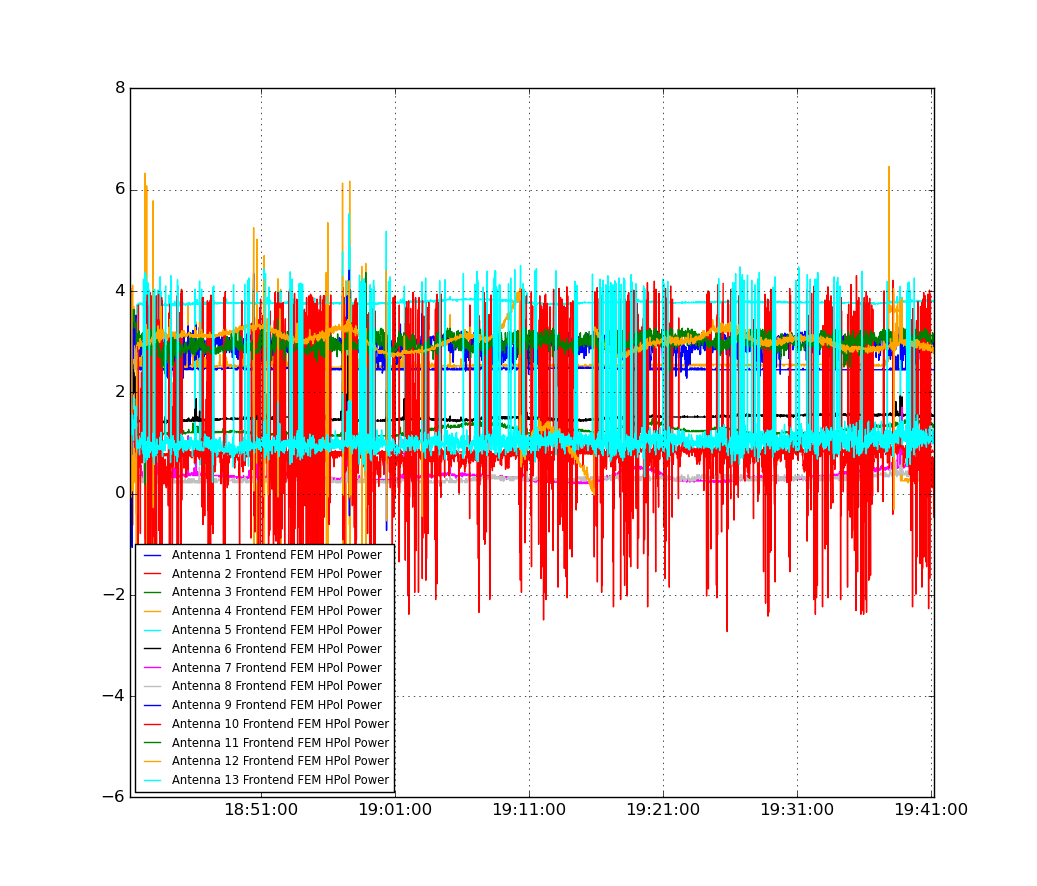
What you should see is the dBm values of the antenna fluctuating very violently like in Figure 1 and 2. Notice that the amplitude of the fluctuation is ~3 dB, which was one FEMATTN step (at this date). This happens when hattn/vattn settings of the antenna get changed somehow and two polarizations get very unbalanced. The result is that the automatic gain control is not being able to find a happy level for both at the same time, and went into an oscillation. To calm it down, first issue the commands:
femauto-off ant#
hattn 0 0 ant#
vattn 0 0 ant#
which turns off the automatic gain control. And then set the hattn and vattn settings until both power levels were around 3 dB, i.e.:
hattn 0 12 ant#
vattn 0 11 ant#
where the choice of attenuations (12 and 11) were those that set the power level close to 3 dB. Finally, turn the gain control back on, with
femauto-on ant#
If the fluctuation is within one FEMATTN step (2 dB as of 12/12/16, check Schedule Command - FEMATTN level), the cause might be just interference. In this case, leave it for a while and see if the oscillation goes away.
Data recording (DPP)
Data recording has stopped (ls /data1/IDB |tail does not return the most recent file)
You need to delete dpplock.txt file. Follow these steps:
1. Enter "top" into user@dpp.solar.pvt command line (if user@dpp.solar.pvt is not there, open a new terminal/terminal tab in VNC viewer & type “ssh -X user@dpp.solar.pvt).
2. Look for "dppxmp” under “command” column. If it is there, do NOT delete dpplock.txt. If it’s not there, then quit top by hitting “q” and proceed.
3. Type “cd ~/test_svn/Miriad/dpp” (correct directory as of 12/12/2016) and find dpplock.txt which should be there.
4. Type “rm dpplock.txt” to remove the lock file.
Network
Cannot open VNC Viewer, or VNC Viewer's response is too slow
Open the “local” raw command window and Stateframe window by following these steps:
1. Type "cd Dropbox/PythonCode/Current" in helios.solar.pvt terminal of MobaXterm
2. Type "./sched_commands.py" for raw command window
3. Type "./sf_display.py" for Stateframe window (add “ &” in the end if you want to keep typing the command in the same helios window) -- note that this Stateframe window may take a while (~5 min or more) to load.
Others
Strong interference in flare monitor
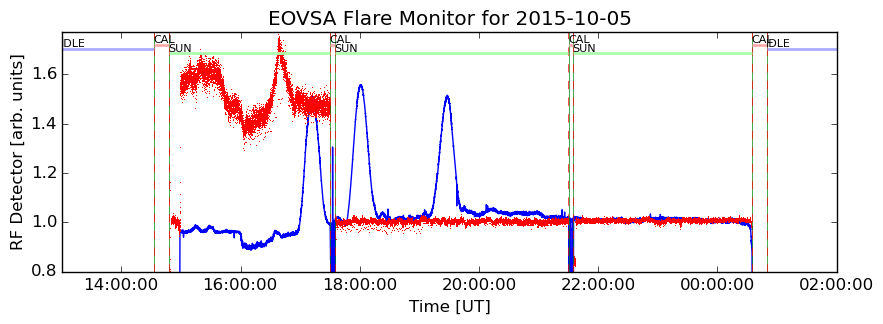
Every once in a while (around Mar. 5 and Oct. 5), the Sun enters in geosynchronous satellite belt. In this case, we see strong signals on flare monitor, like in Figure 3 (blue line). These are radio signals from man-made satellites, so don't be alarmed.
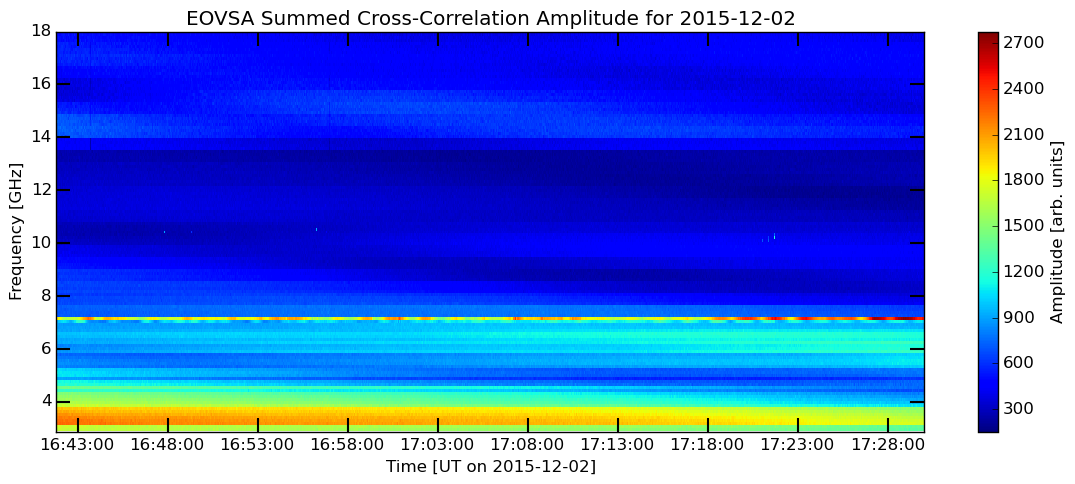
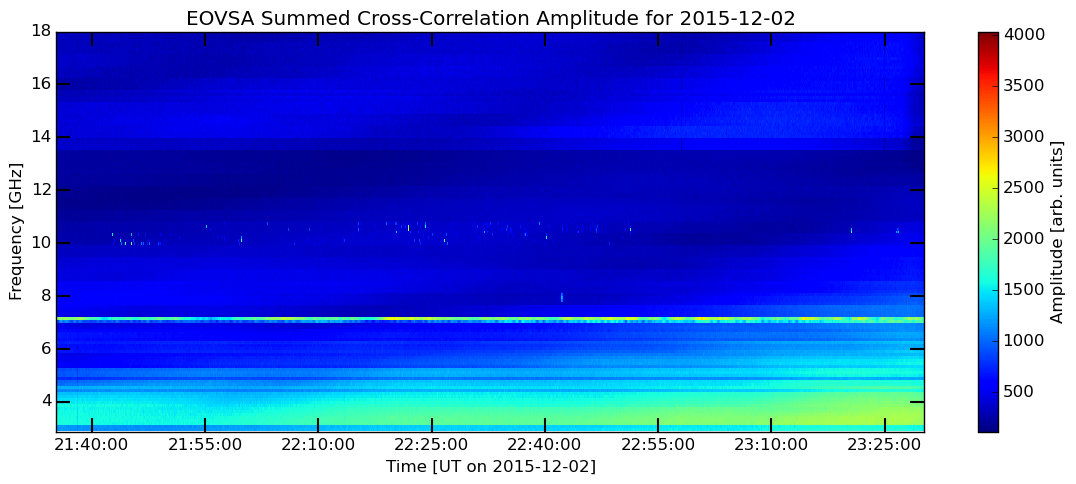
The “streak” in the lowest frequency of the dynamic spectrum
If you are seeing this at the beginning or at the end of the day, this is the Sun! See Figure 4 and Figure 5 for sample images. When the baseline is foreshortened (as in near sunrise or sunset), the response is quite strong to the solar disk. As the Sun rises, the intensity goes down because the baselines start to get longer. You will actually see the reverse trend in the afternoon, although often the RFI is stronger so the color scale is more blue than in the morning.
