Uploads by Bchen
Jump to navigation
Jump to search
This special page shows all uploaded files.
| Date | Name | Thumbnail | Size | Description | Versions |
|---|---|---|---|---|---|
| 11:09, 20 August 2025 | Fleishman2025 fig1.jpg (file) |  |
391 KB | 1 | |
| 10:59, 20 August 2025 | Cold flare.jpeg (file) |  |
19 KB | Smaller size | 2 |
| 15:31, 19 August 2025 | SEP illustration gemini.jpeg (file) |  |
77 KB | This is an illustration of a solar energetic particle event generated by Google Gemini 2.5 pro. | 1 |
| 15:17, 19 August 2025 | Wang2025 fig3.jpg (file) |  |
299 KB | 1 | |
| 15:17, 19 August 2025 | Wang2025 fig2.jpg (file) |  |
285 KB | 1 | |
| 15:15, 19 August 2025 | Wang2025 fig1.jpg (file) |  |
280 KB | 1 | |
| 18:00, 2 August 2025 | Kou2025 fig2.jpg (file) |  |
221 KB | Figure 2 of the OVSA Science Highlight blurb contributed by Y. Kou. | 1 |
| 17:57, 2 August 2025 | Kou2025 fig1.jpg (file) |  |
509 KB | Fig 1 of OVSA Science Highlight blurb contributed by Y. Kou | 1 |
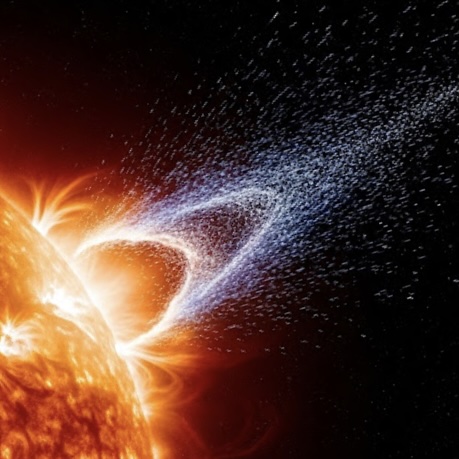
| 17:38, 2 August 2025 | Solar eruption nasa.jpeg (file) |  |
202 KB | Source: https://www.nasa.gov/image-article/solar-eruption/ A solar eruption gracefully rose up from the sun on Dec. 31, 2012, twisting and turning. Magnetic forces drove the flow of plasma, but without sufficient force to overcome the sun’s gravity much of the plasma fell back into the sun. The length of the eruption extends about 160,000 miles out from the sun. With Earth about 7,900 miles in diameter, this relatively minor eruption is about 20 times the diameter of our planet.› See video a... | 1 |
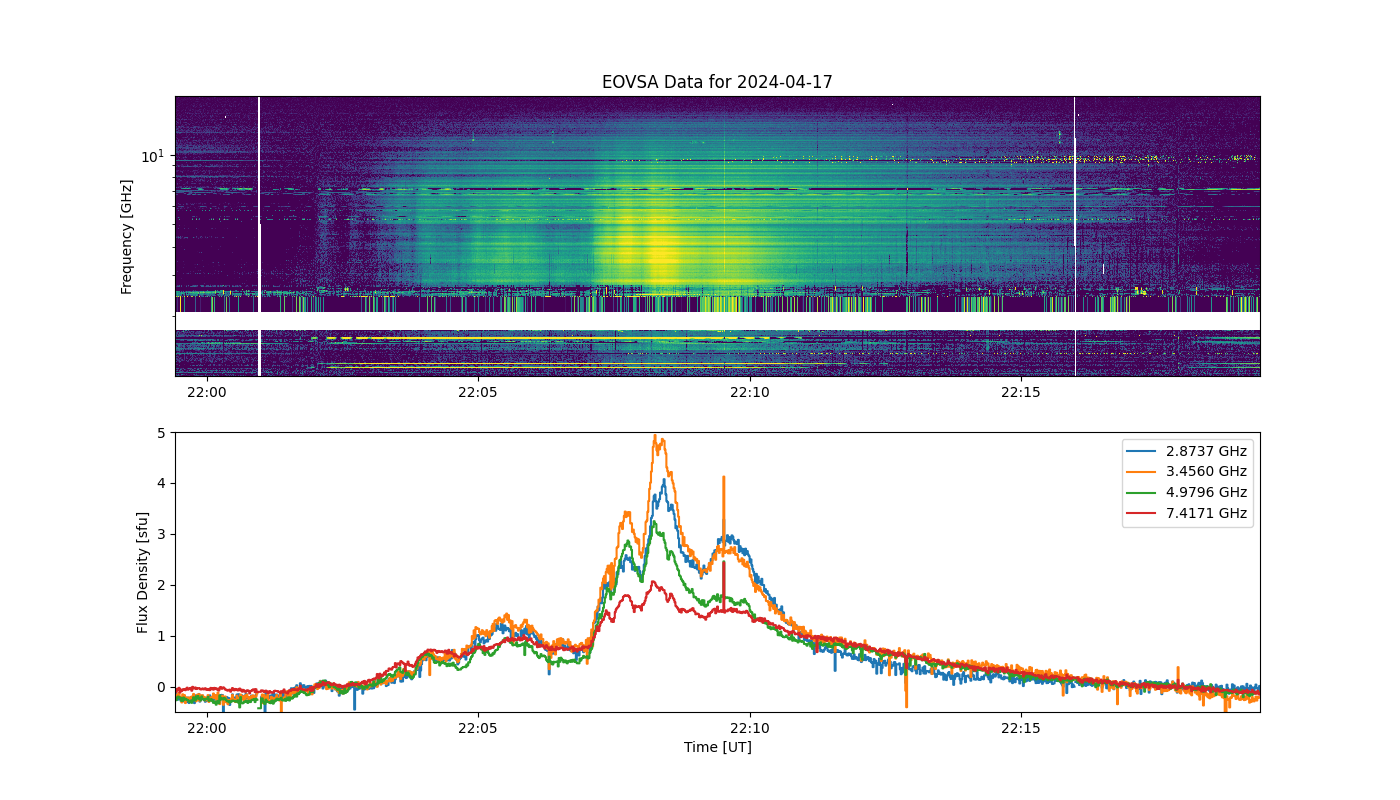
| 00:39, 31 July 2025 | Eovsa.spec.flare id 20240417220800.png (file) |  |
841 KB | Redo the flare spectrogram as the original FITS file is missing. | 2 |
| 18:53, 18 July 2025 | MeerKAT.png (file) |  |
773 KB | 1 | |
| 18:50, 18 July 2025 | RadioNightSky med.jpg (file) |  |
175 KB | 1 | |
| 13:13, 15 June 2025 | IDL synop tp 20211028 bkgsub plotman.jpg (file) |  |
340 KB | Exploring EOVSA synoptic total power spectrogram plot using SSWIDL's plotman widget. | 1 |
| 13:10, 15 June 2025 | IDL synop tp 20211028 bkgsub.jpg (file) |  |
139 KB | SSWIDL plot of EOVSA synoptic total power data. Using 2021 Oct 28 X1 flare as an example. This one shows the result after pre-flare background subtraction. | 1 |
| 13:07, 15 June 2025 | IDL synop tp 20211028.jpg (file) |  |
195 KB | SSWIDL plot of EOVSA synoptic total power data for the 2021 Oct 28 X1 flare | 1 |
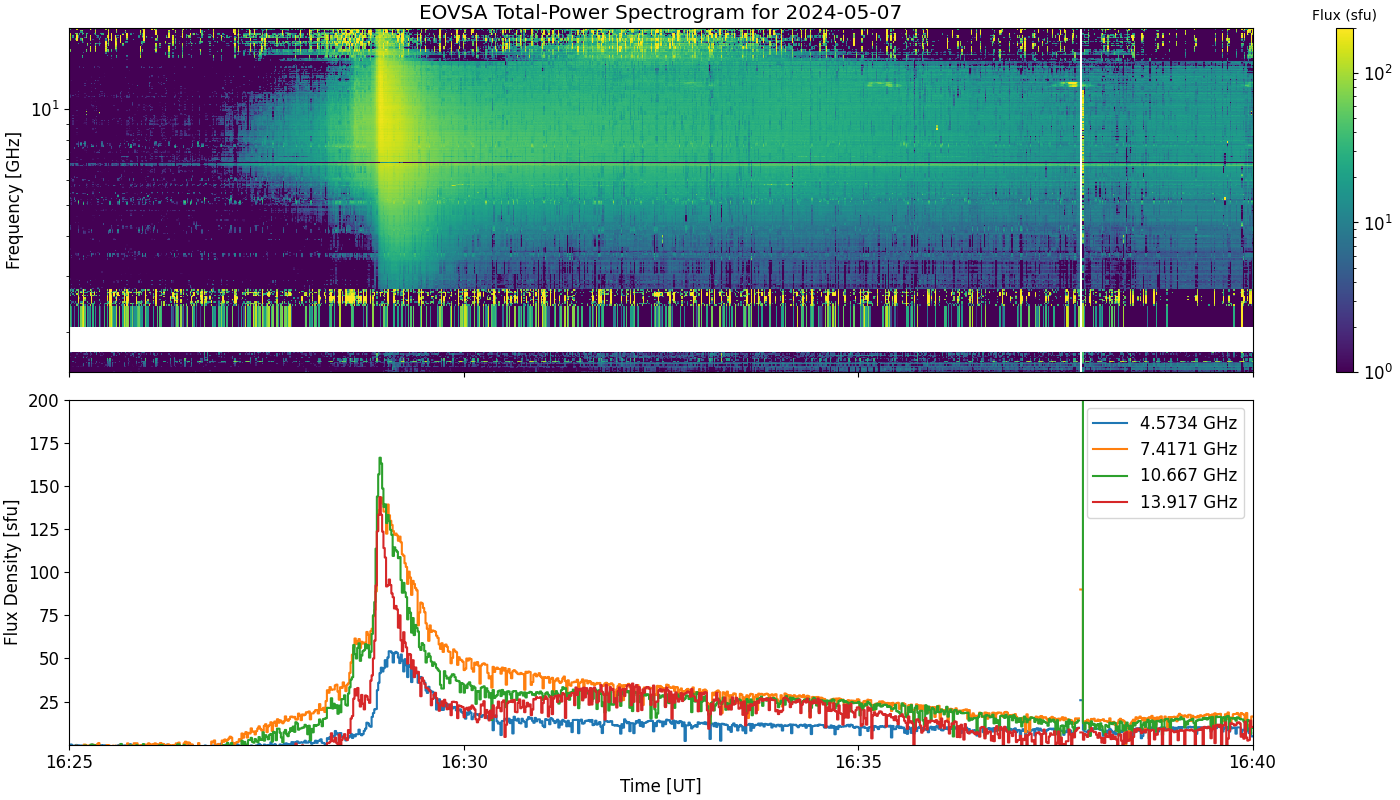
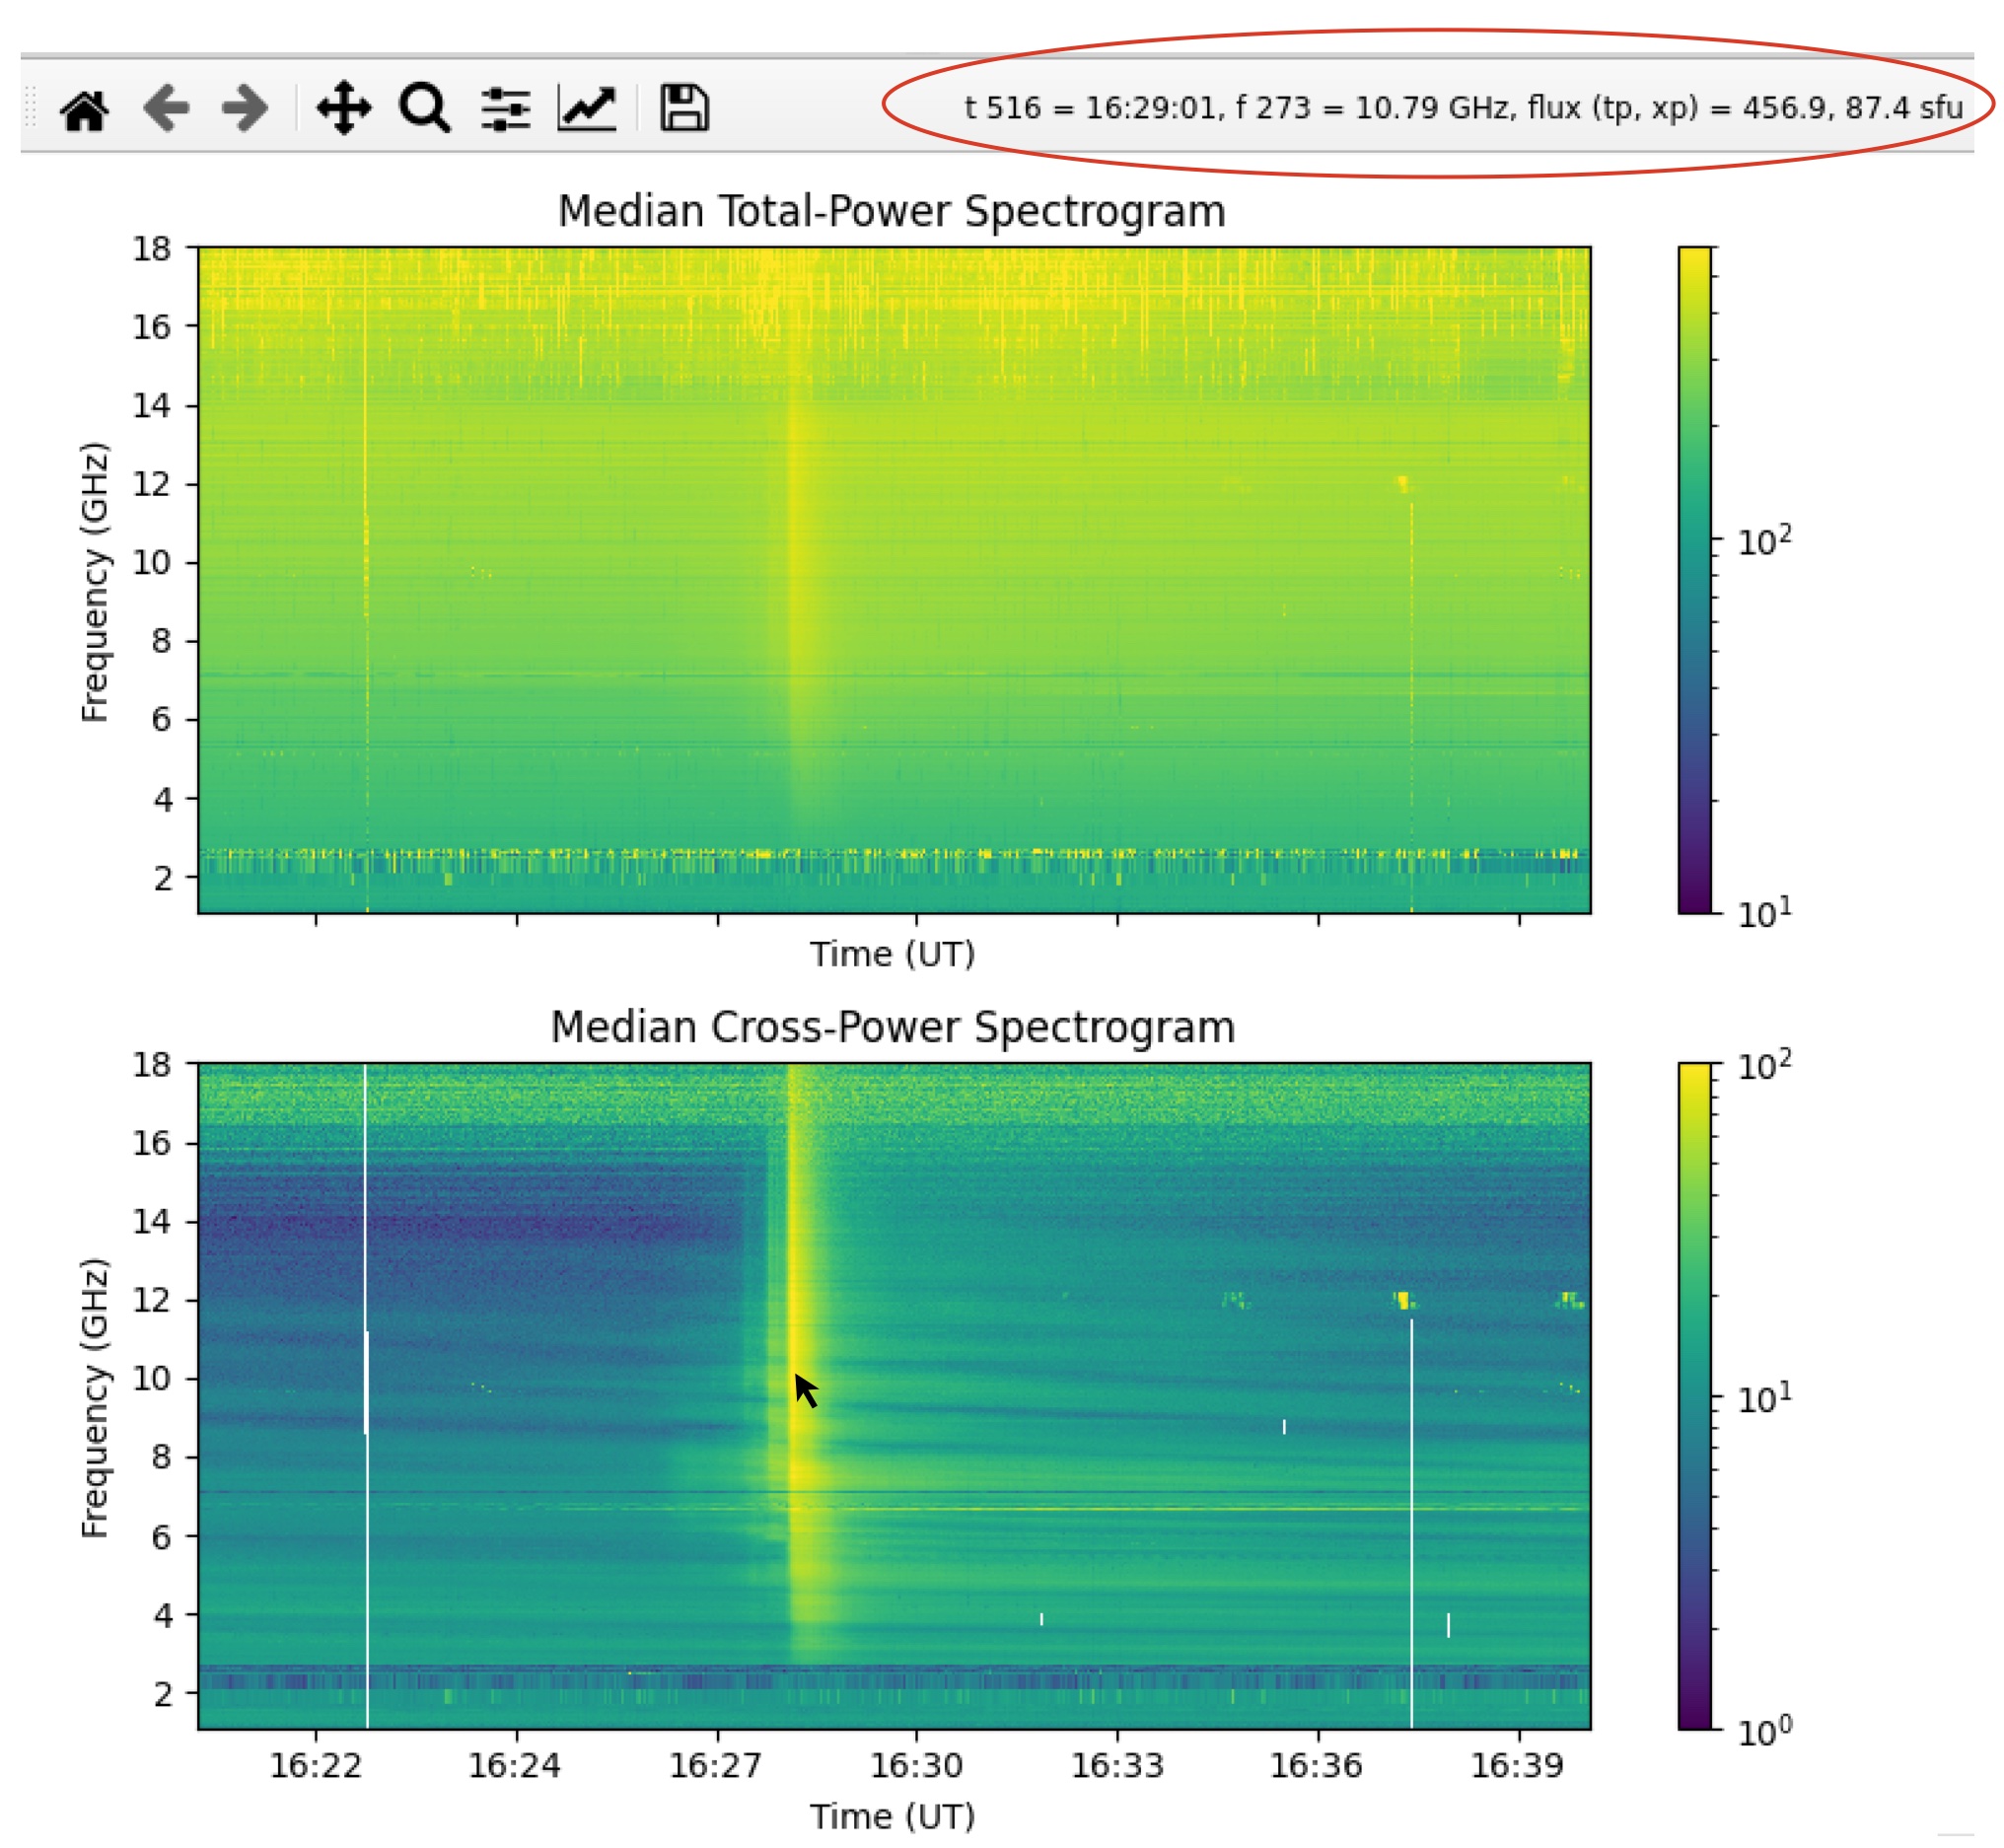
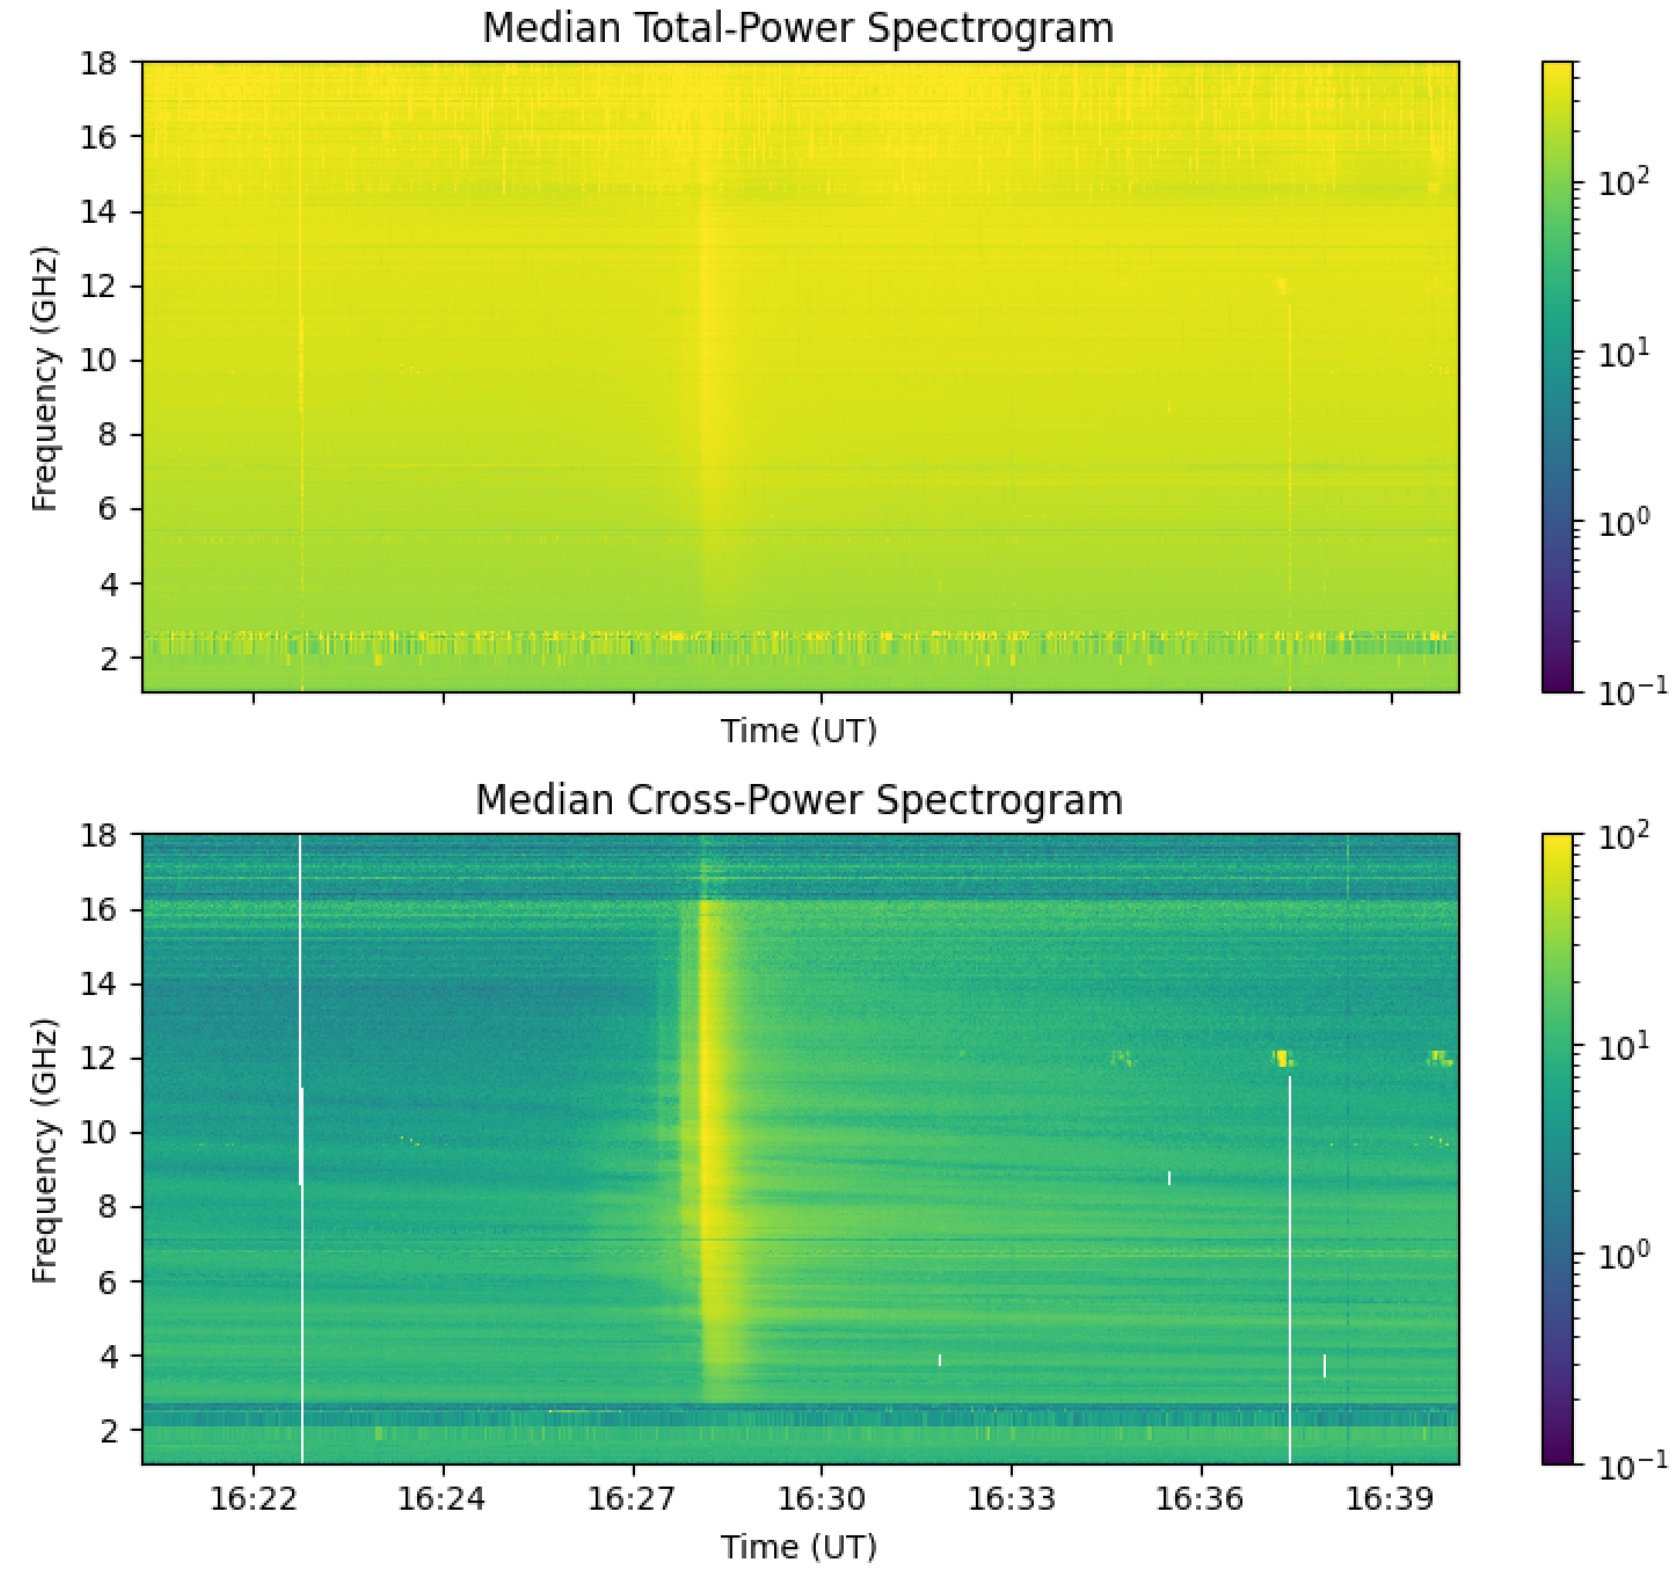
| 23:29, 15 October 2024 | Eovsa.spec tp.flare id 202405071629.png (file) |  |
555 KB | 2 | |
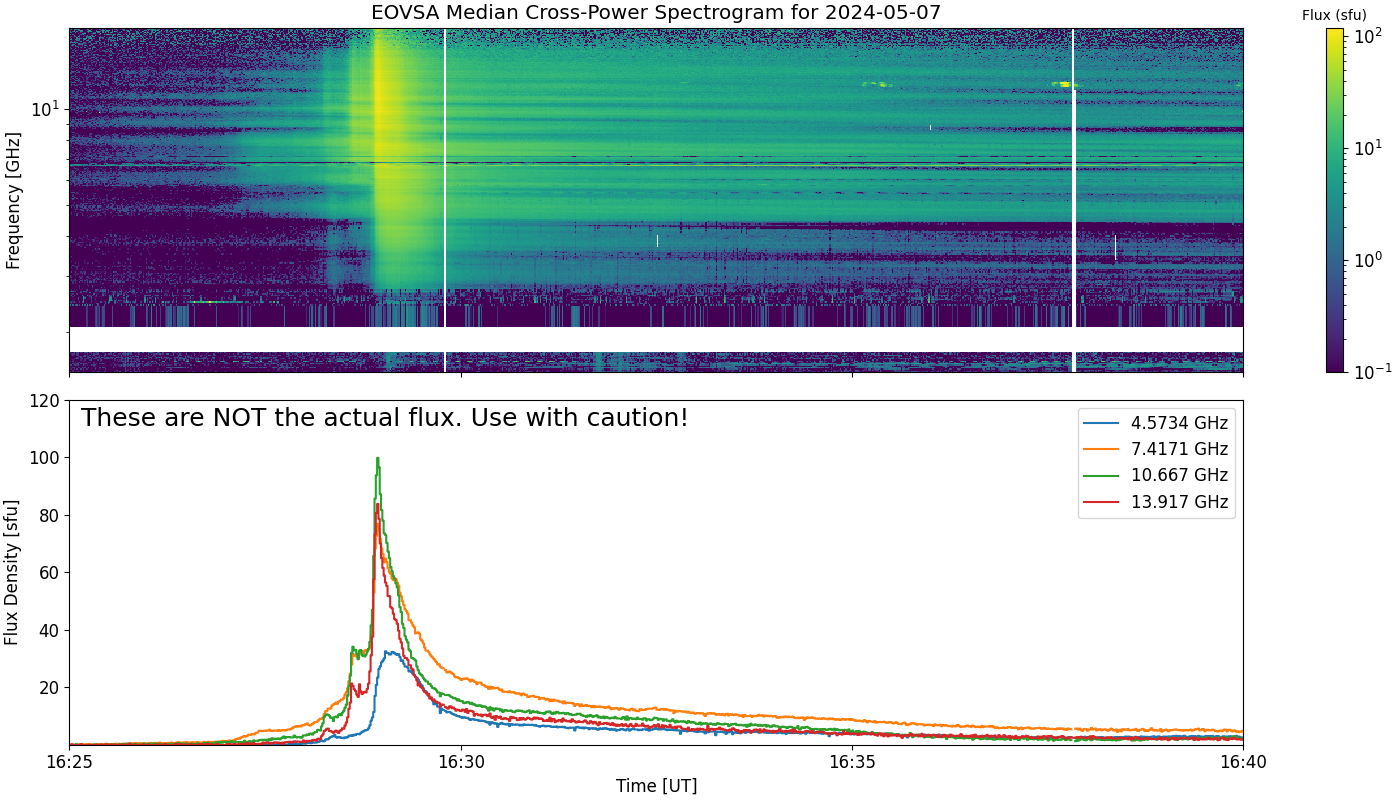
| 23:28, 15 October 2024 | Eovsa.spec xp.flare id 202405071629.png (file) |  |
589 KB | 2 | |
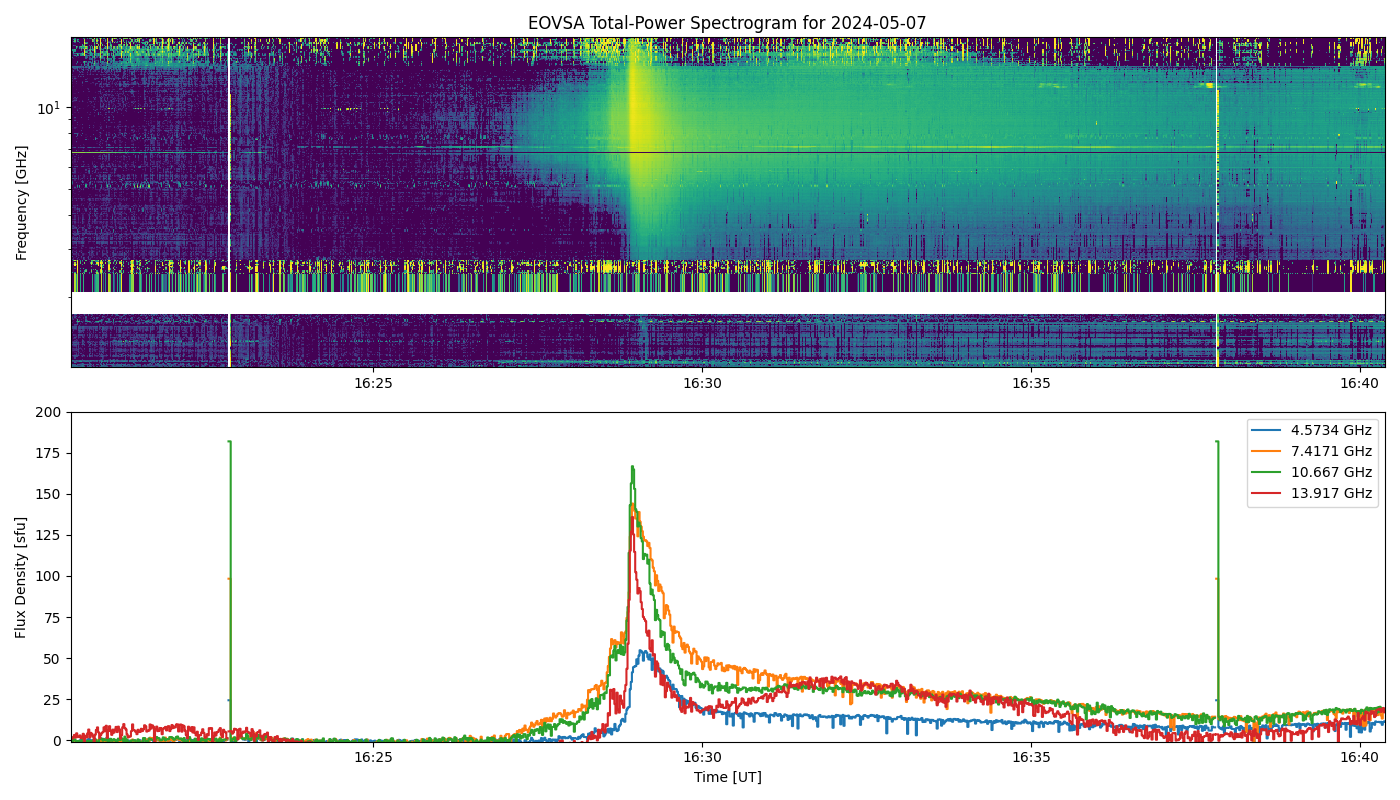
| 13:26, 13 October 2024 | Eovsa.spec tp.flare id 20240507162901.png (file) |  |
709 KB | 1 | |
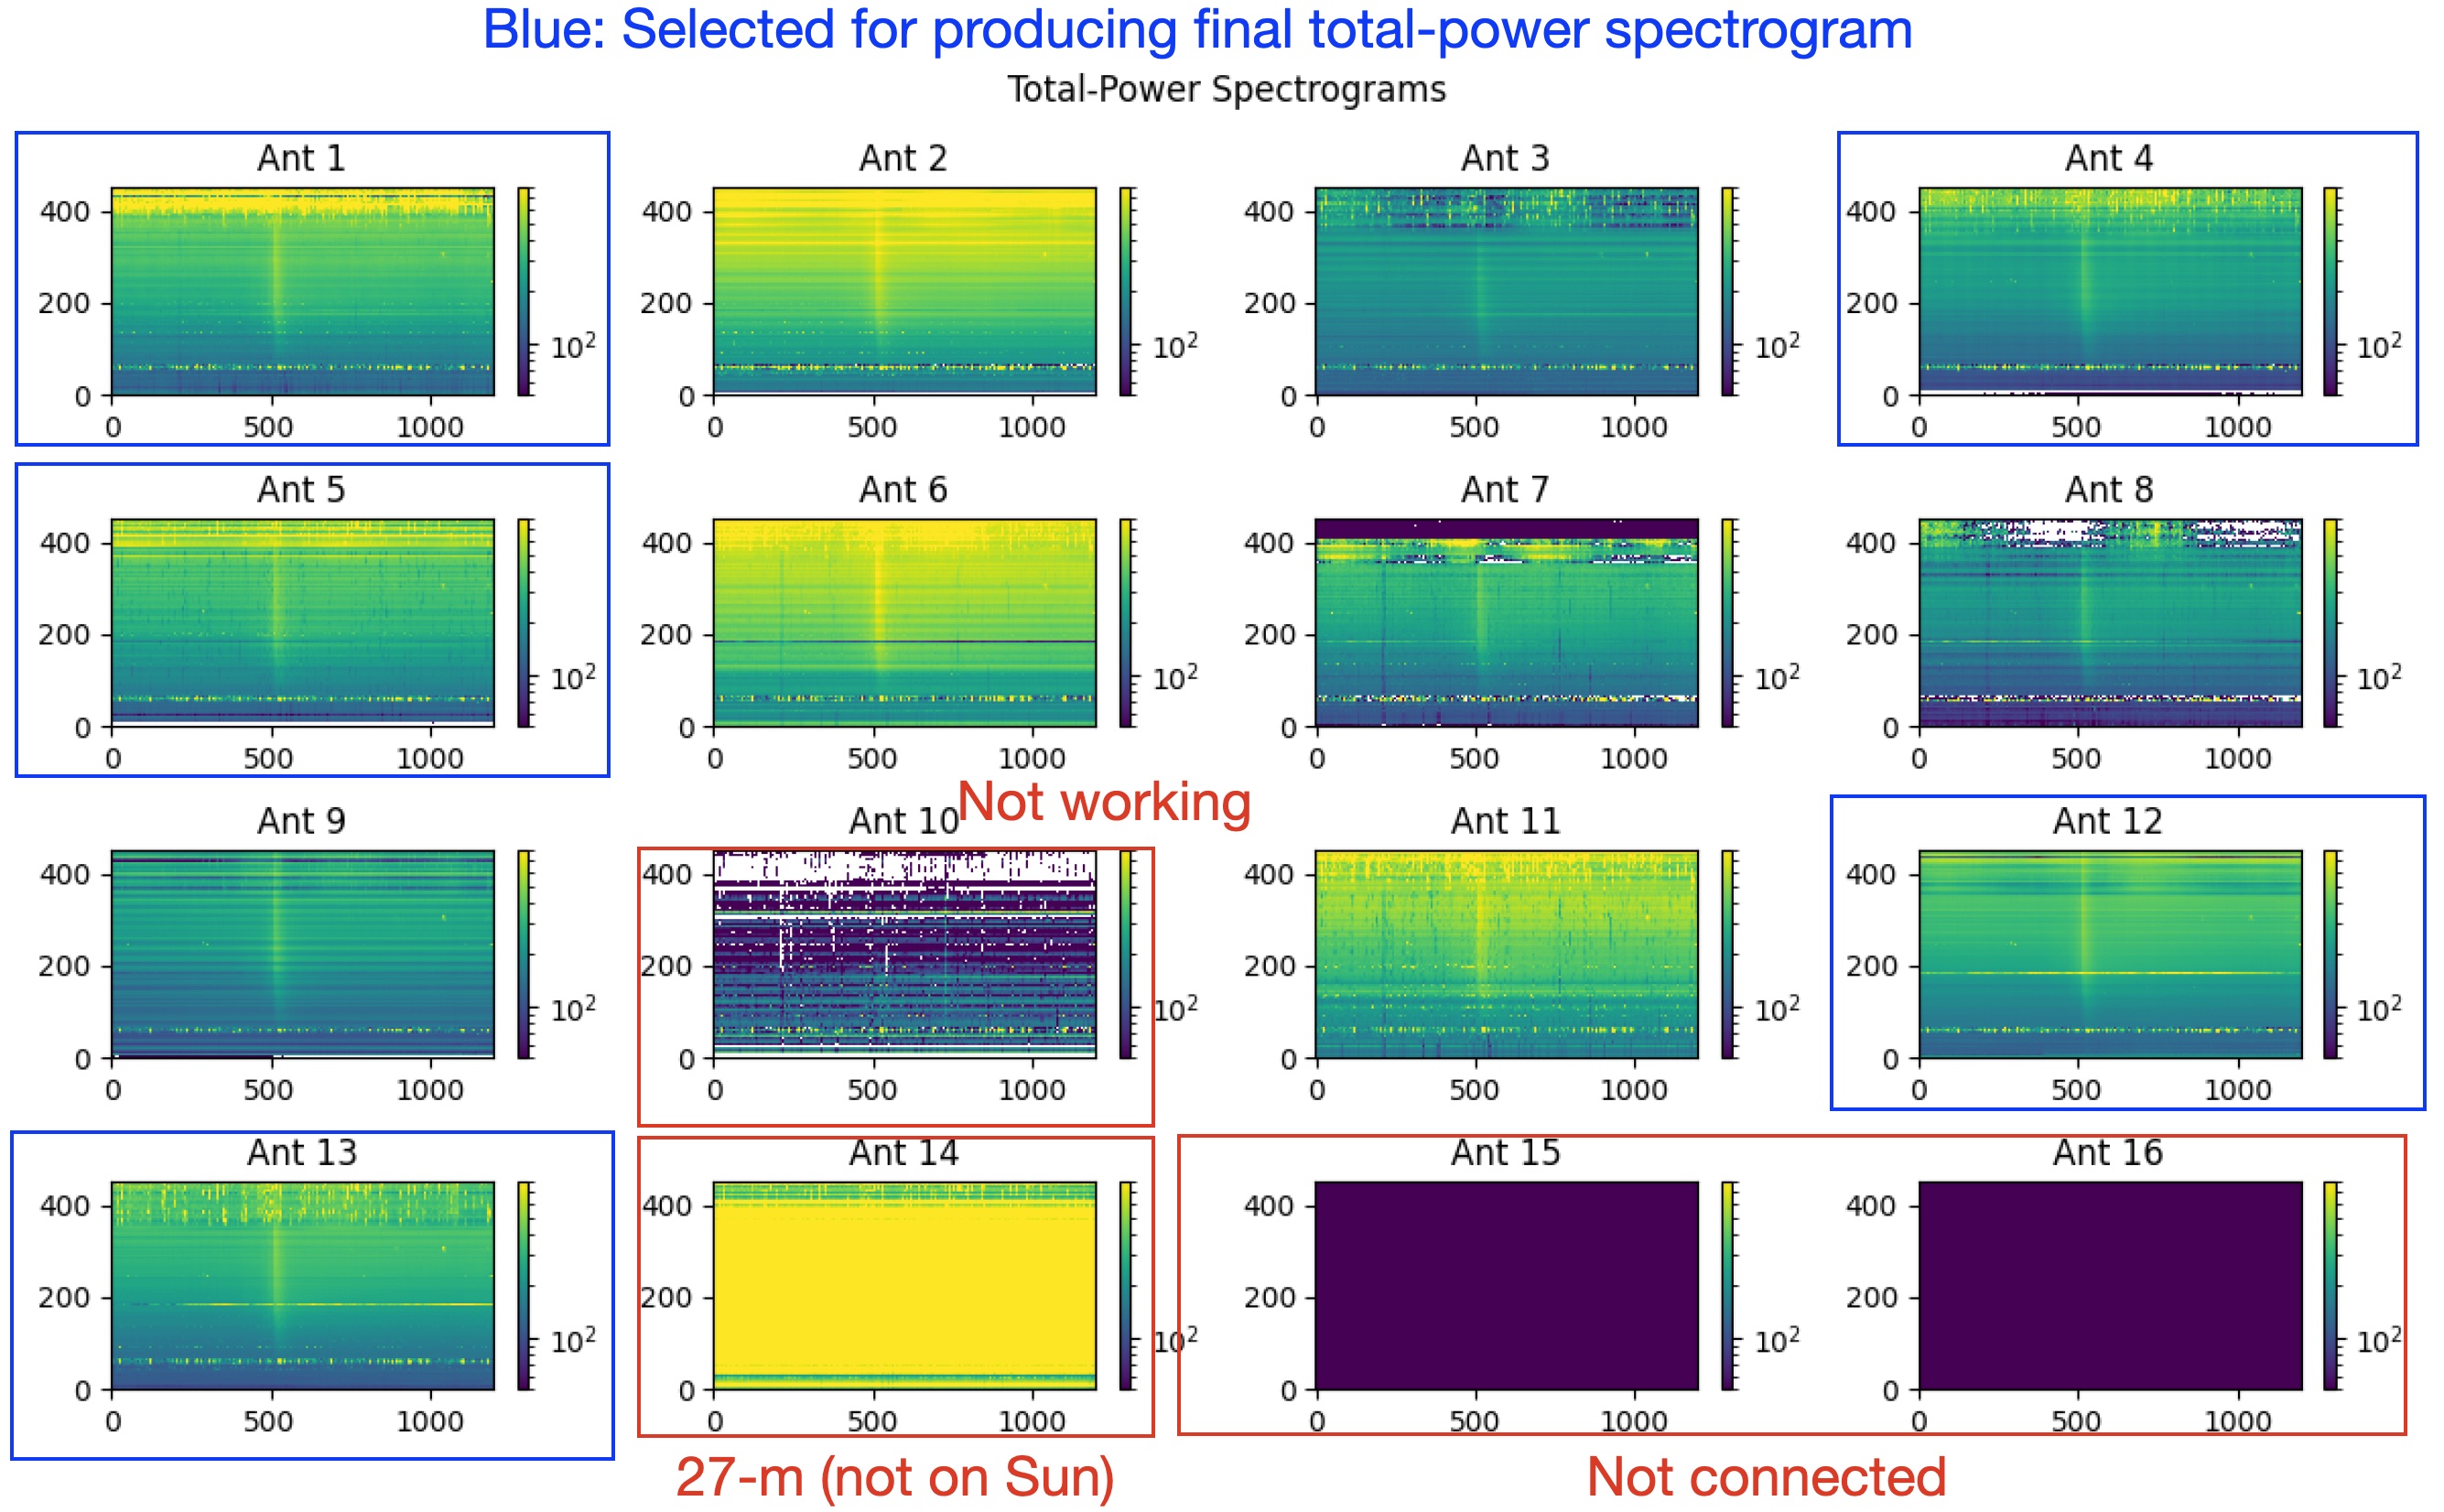
| 13:25, 13 October 2024 | Tpspec ant selection.jpg (file) |  |
920 KB | 1 | |
| 13:02, 13 October 2024 | Specs quicklook adj.jpg (file) |  |
646 KB | 1 | |
| 12:38, 13 October 2024 | Specs quicklook.jpg (file) |  |
466 KB | 2 | |
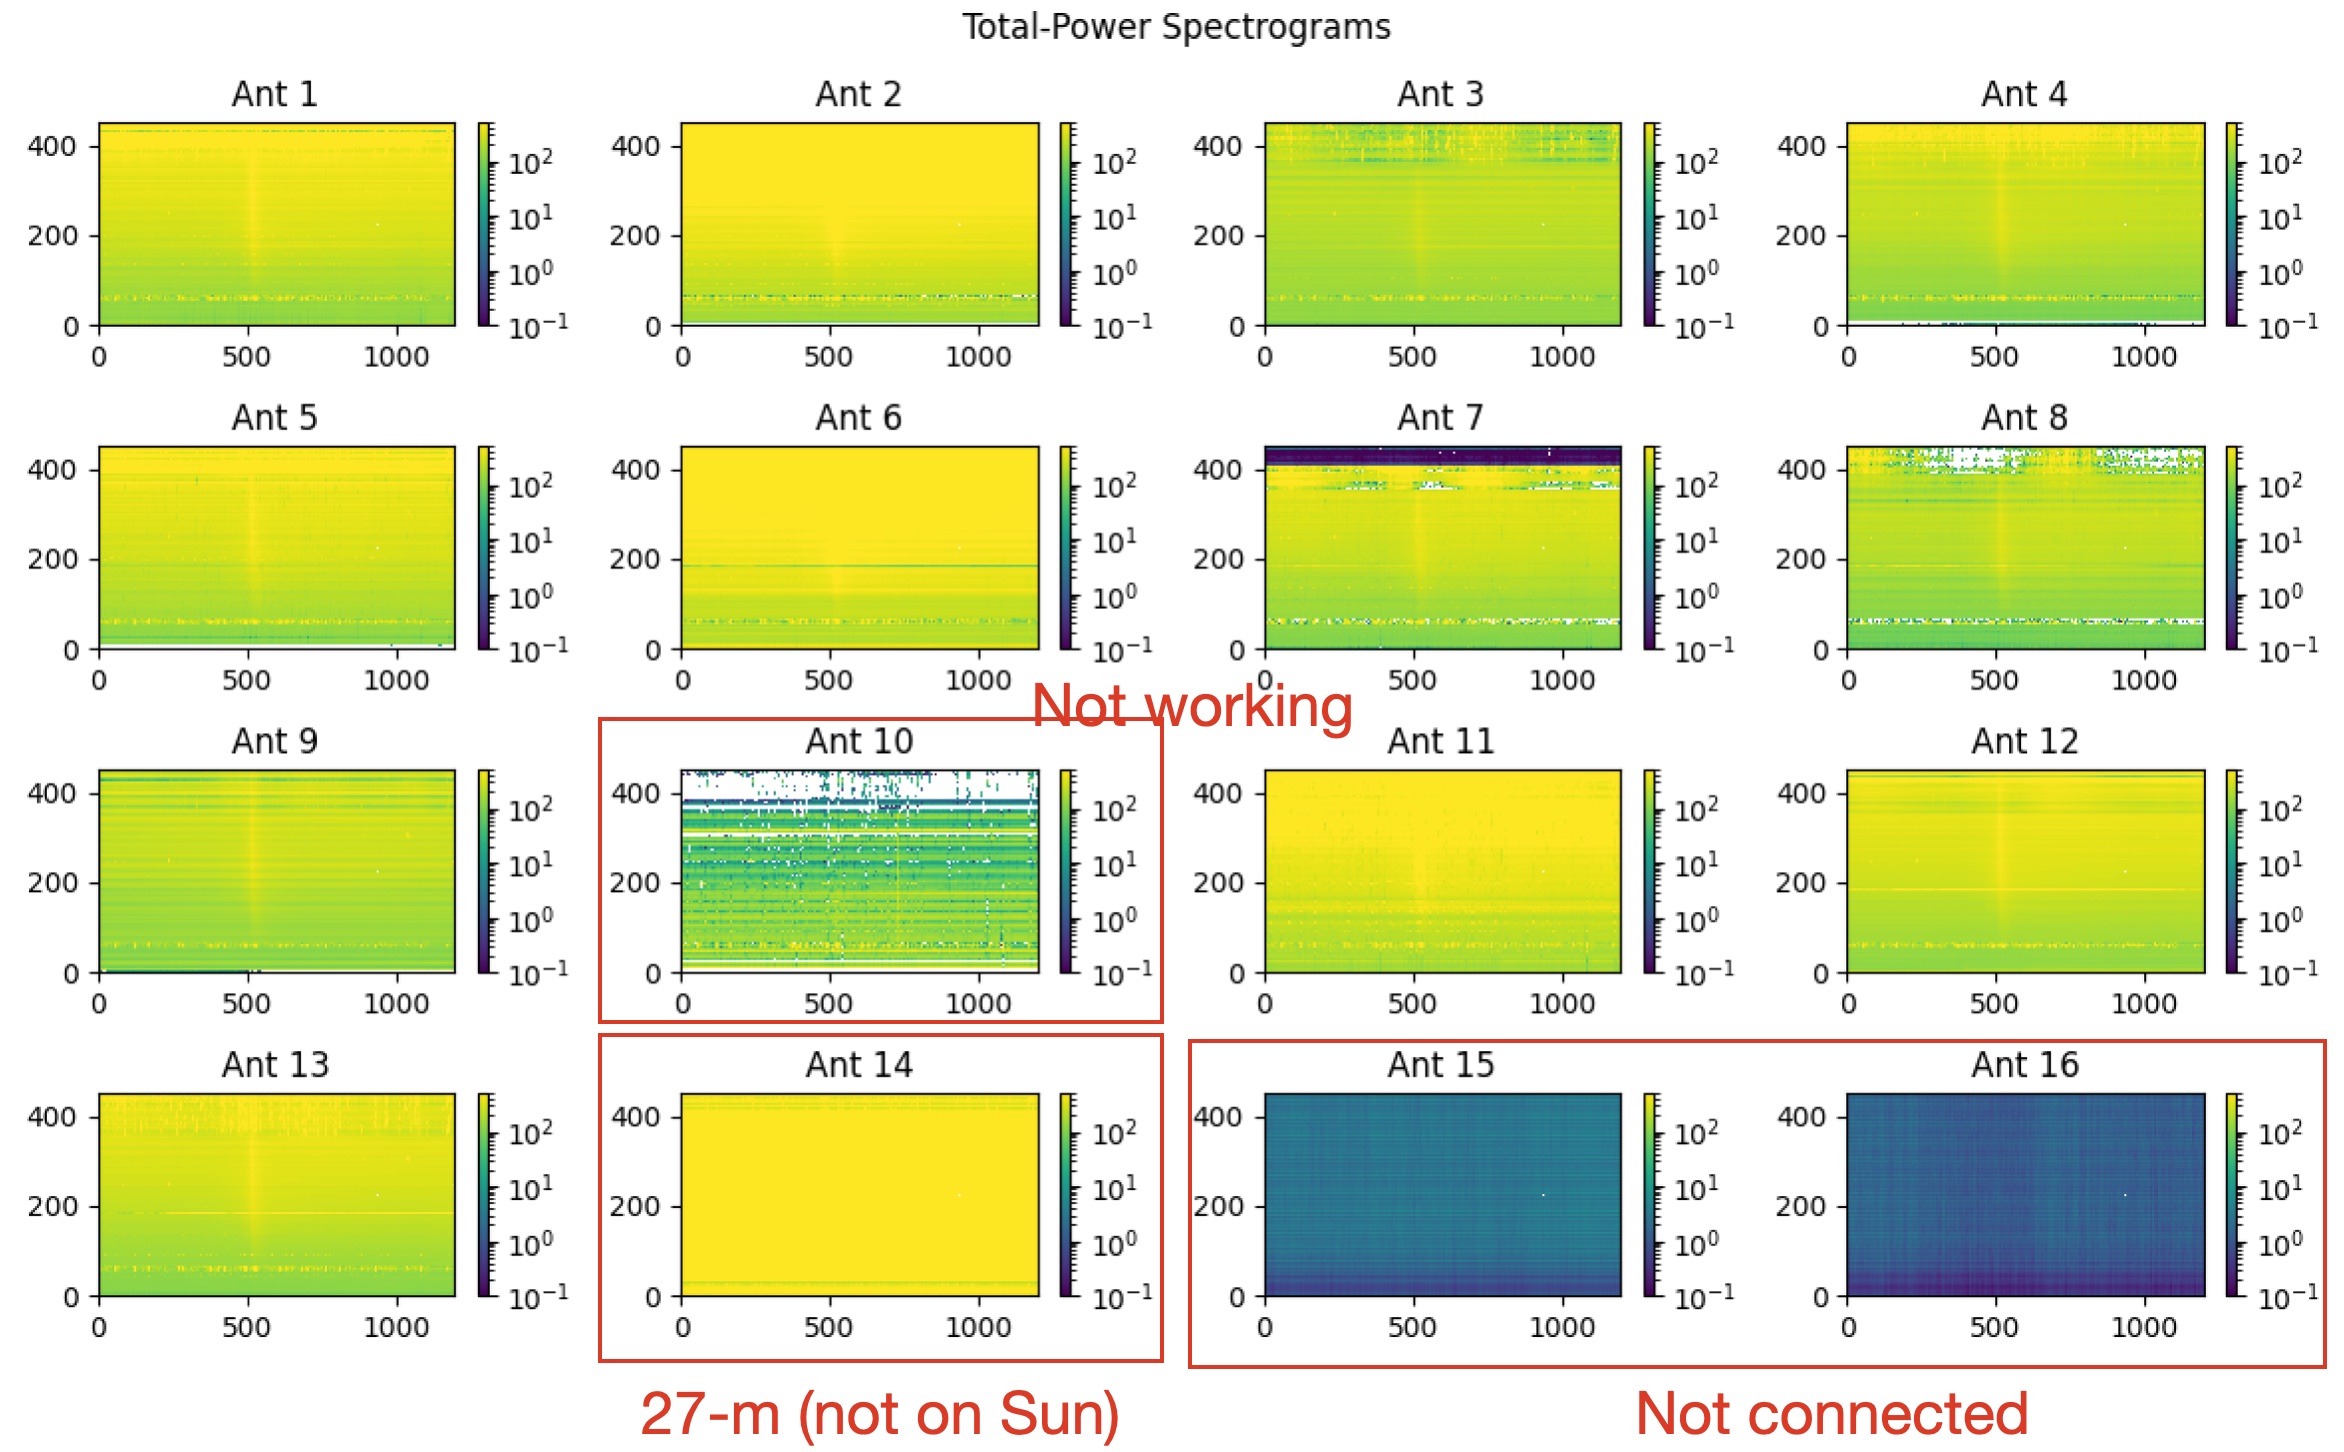
| 20:55, 12 October 2024 | Tpspec all.jpg (file) |  |
637 KB | Total-power spectrograms from all antennas for the M flare on 2024 May 7 | 1 |
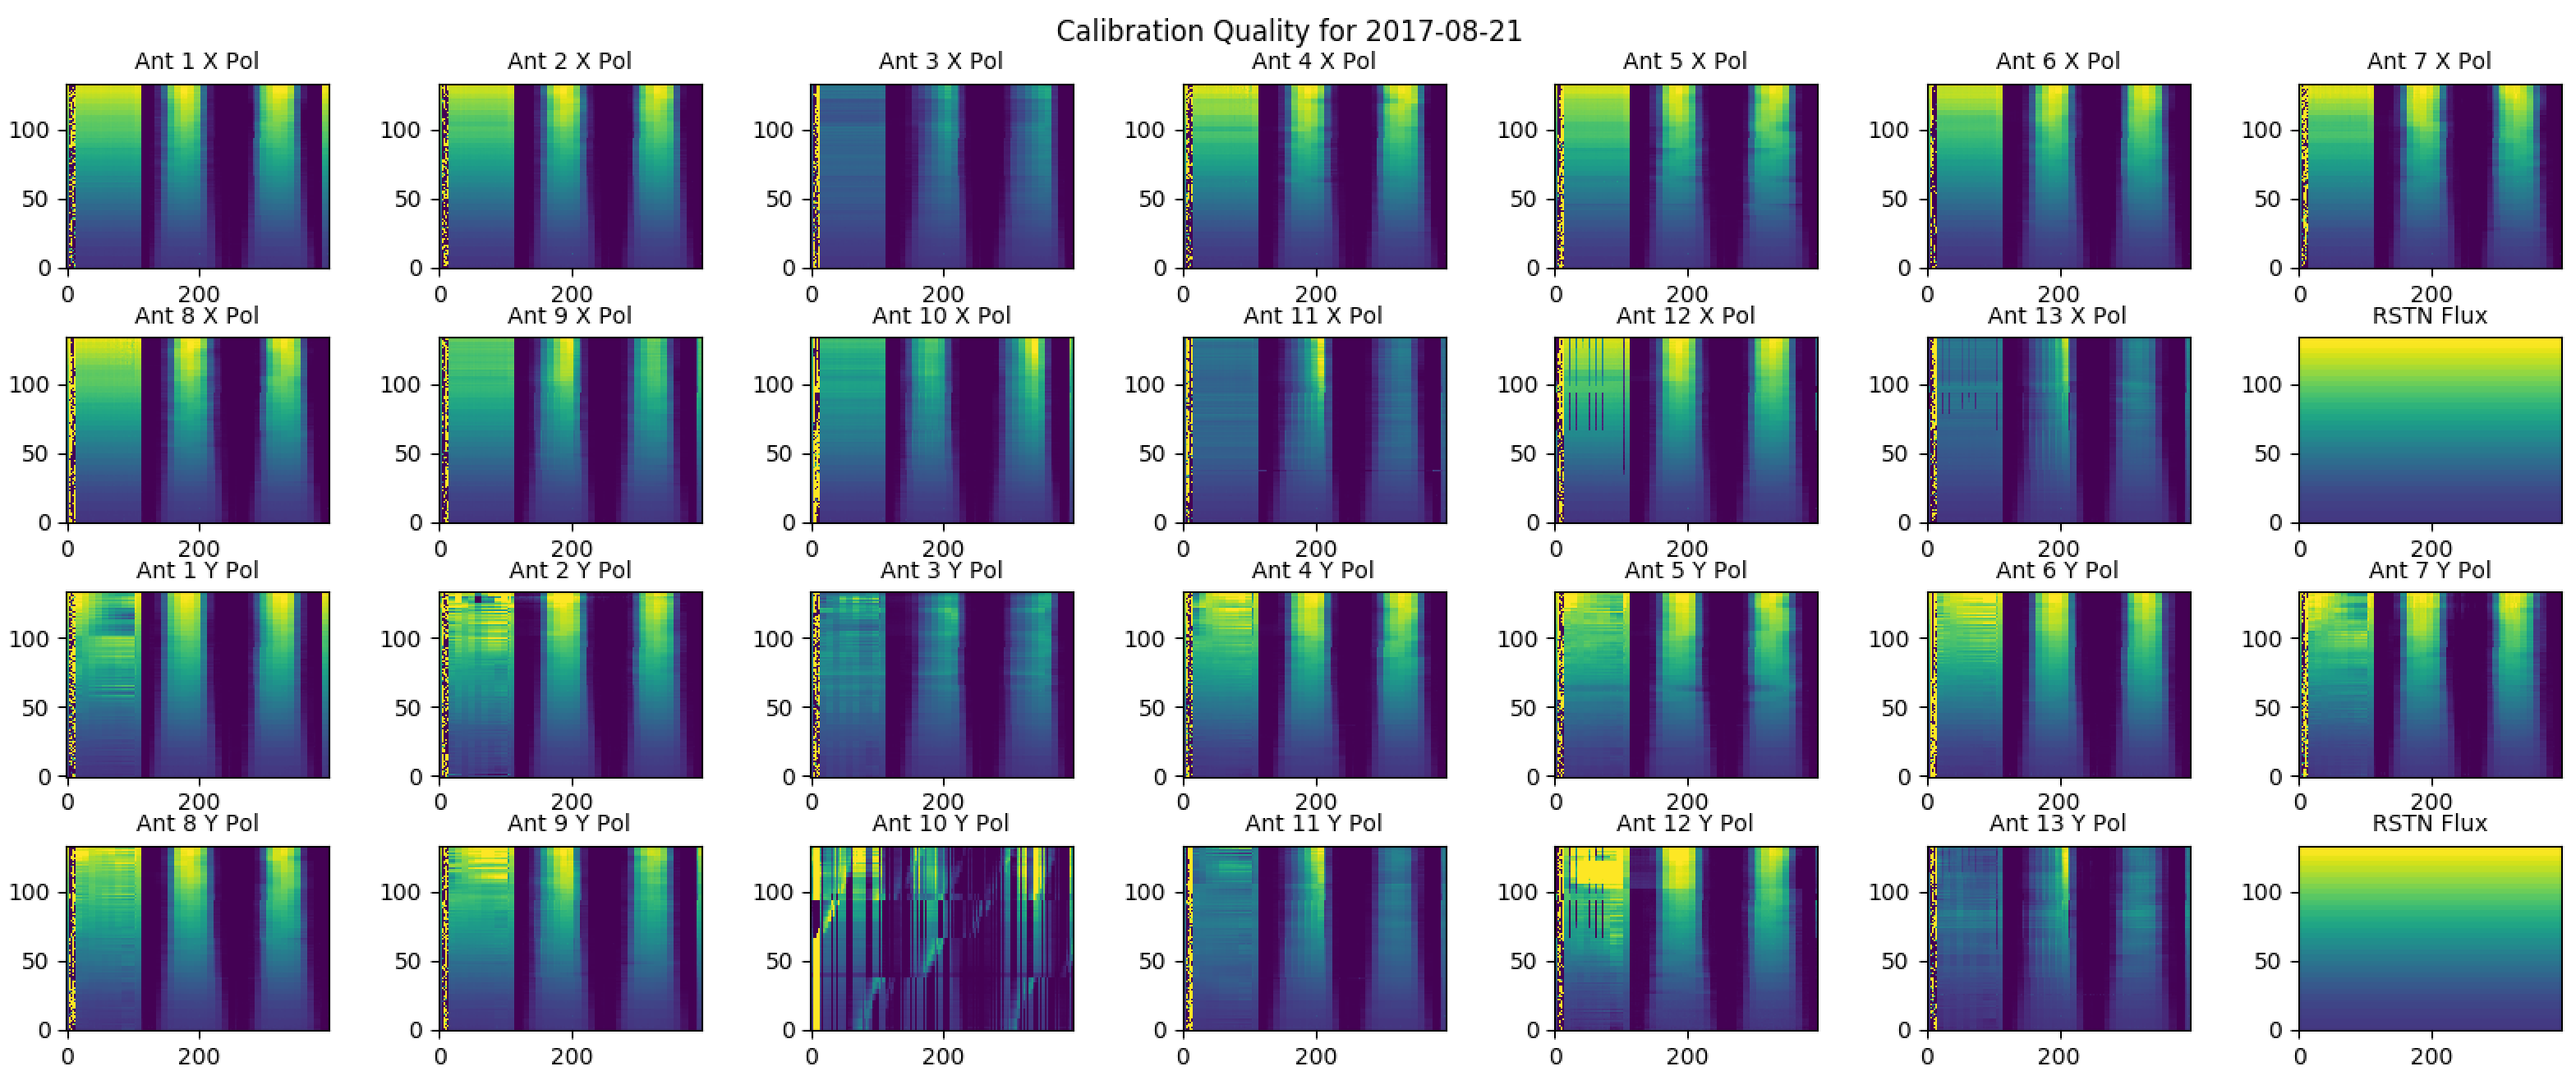
| 15:28, 19 July 2019 | Fig-tp calqual.png (file) |  |
711 KB | Quality of total-power calibration | 1 |
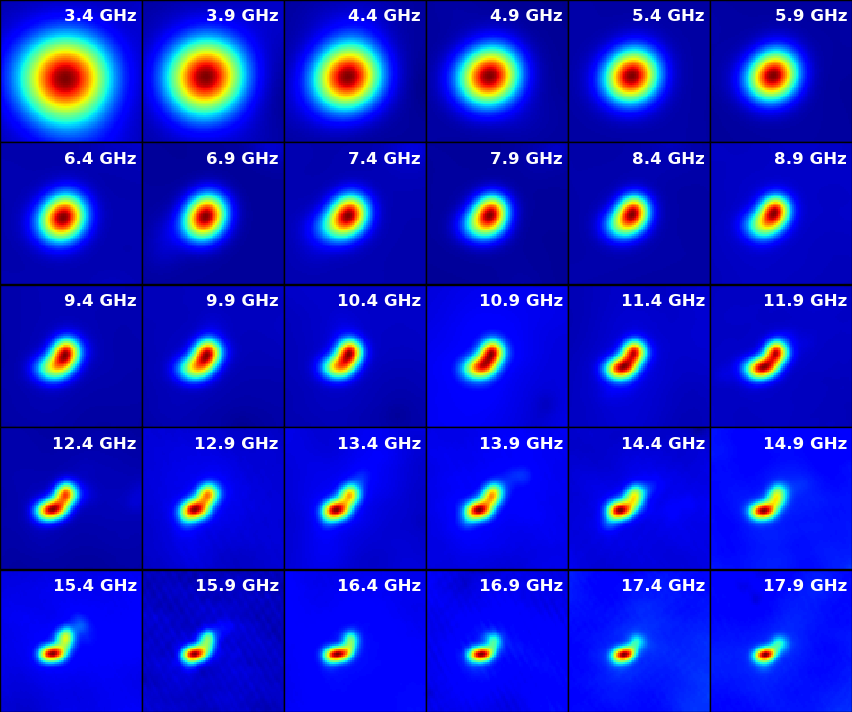
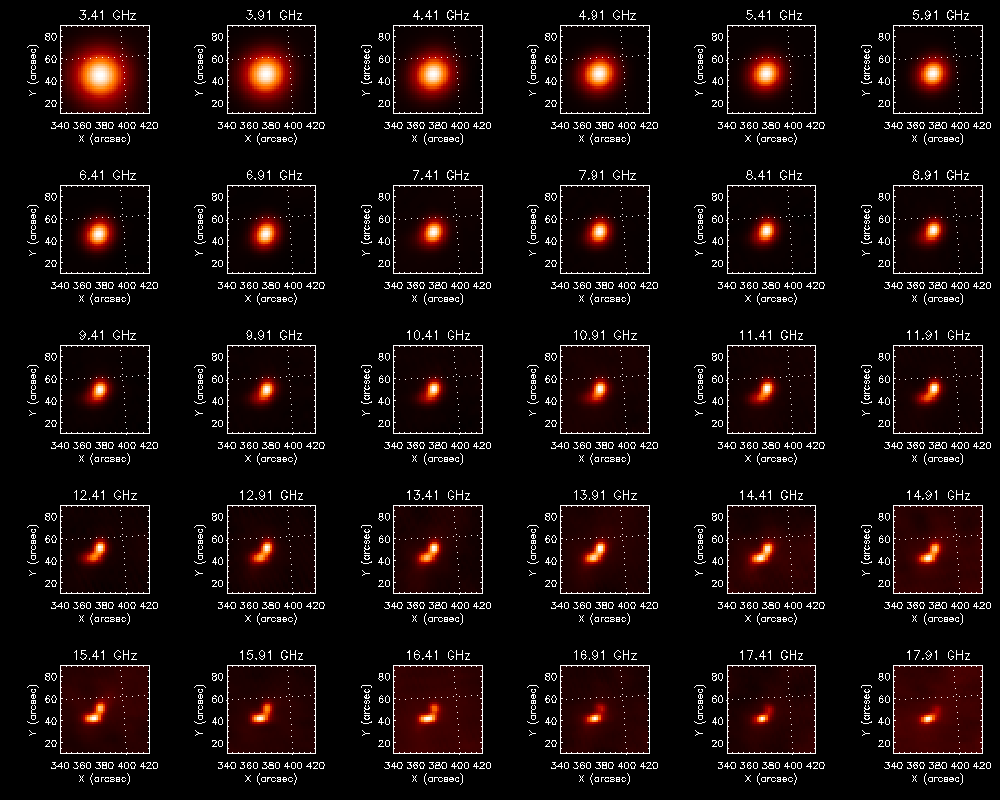
| 16:17, 29 May 2019 | Fig-specimg.png (file) |  |
147 KB | Example of EOVSA spectroscopic imaging at one selected time. | 1 |
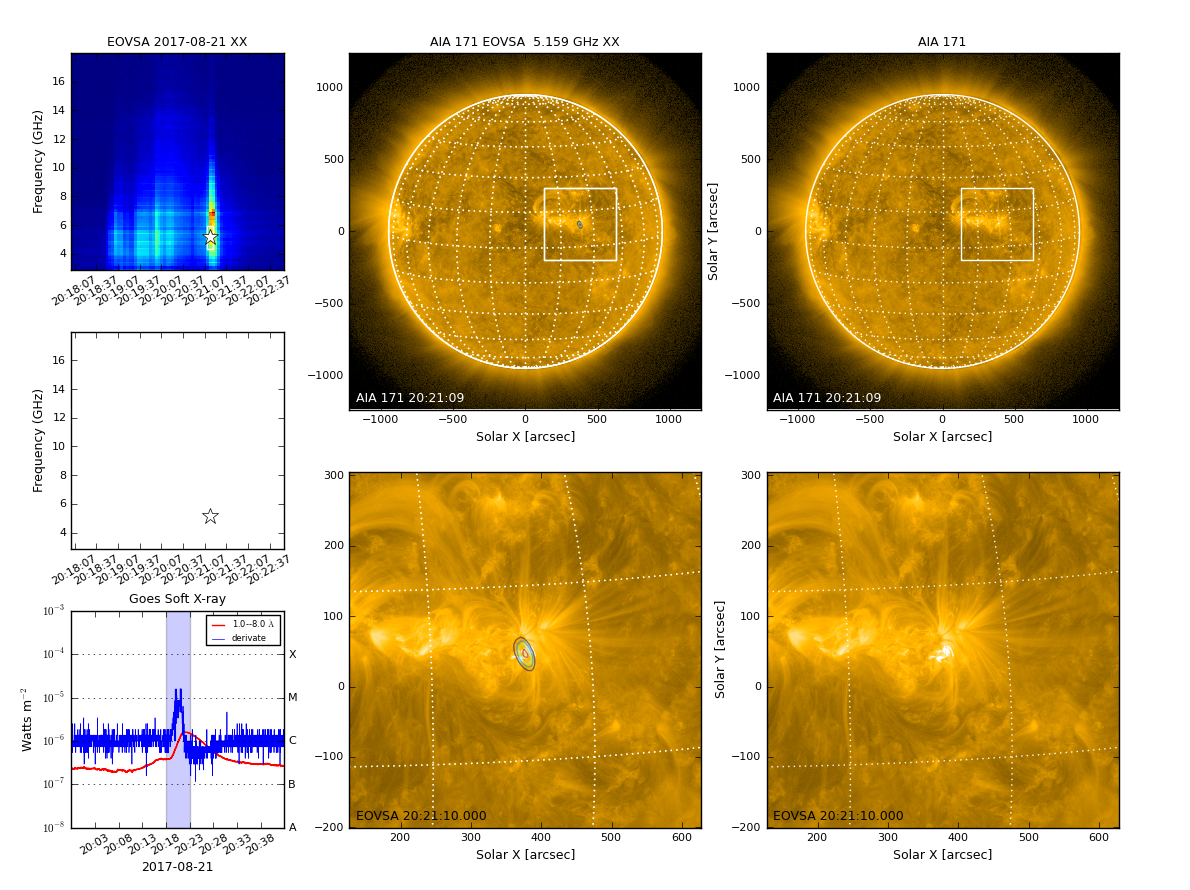
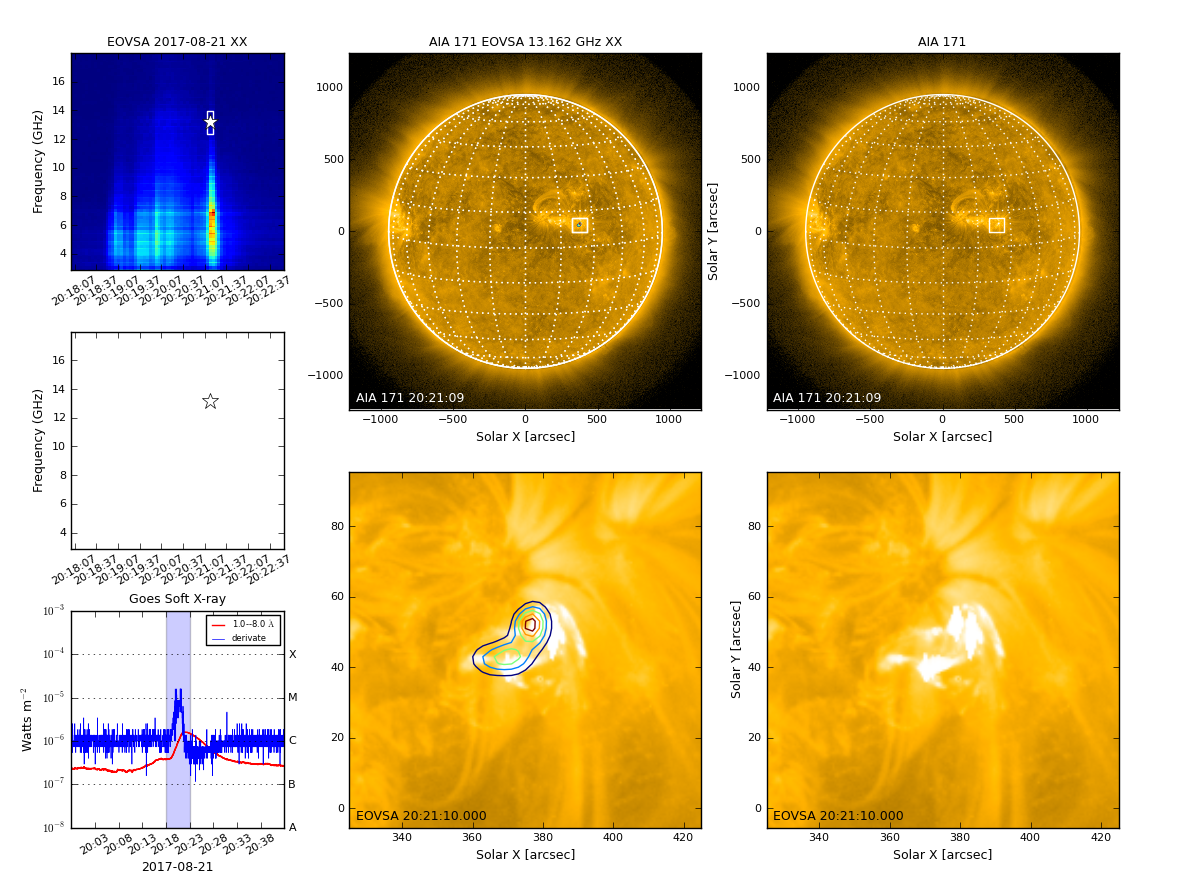
| 13:40, 24 May 2019 | Fig-qlookplot1.png (file) |  |
529 KB | EOVSA quicklook imaging at selected time range and frequency range. Background shows SDO/AIA 171 angstrom image at the closest time. | 1 |
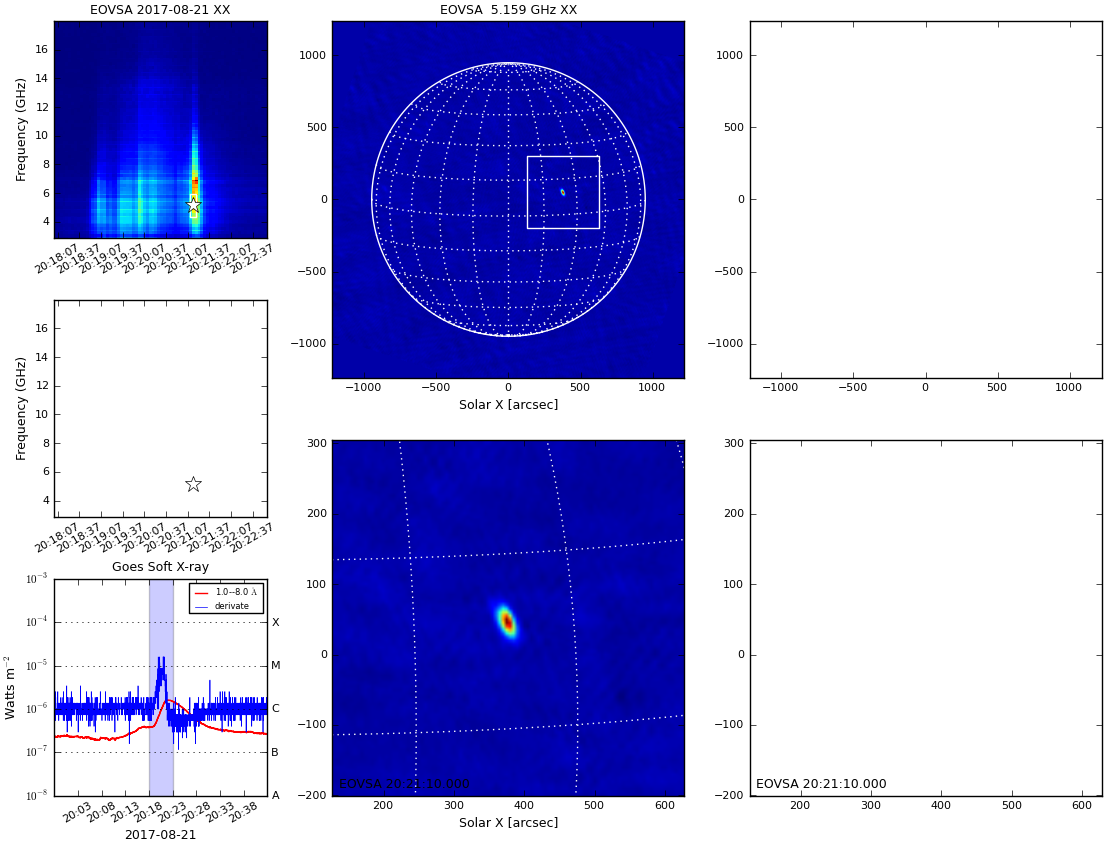
| 13:19, 24 May 2019 | Fig-qlookplot0.png (file) |  |
327 KB | EOVSA quicklook imaging at a selected time range and frequency range. | 1 |
| 12:48, 20 May 2019 | Fig-qlookplot3.png (file) |  |
463 KB | Fix GOES plot date. | 2 |
| 10:53, 20 May 2019 | Fig-specimg idl.png (file) |  |
84 KB | An example of EOVSA multi-frequency images at a selected time (2017-08-21T20:21:15 UT) plotted in SSWIDL. | 1 |
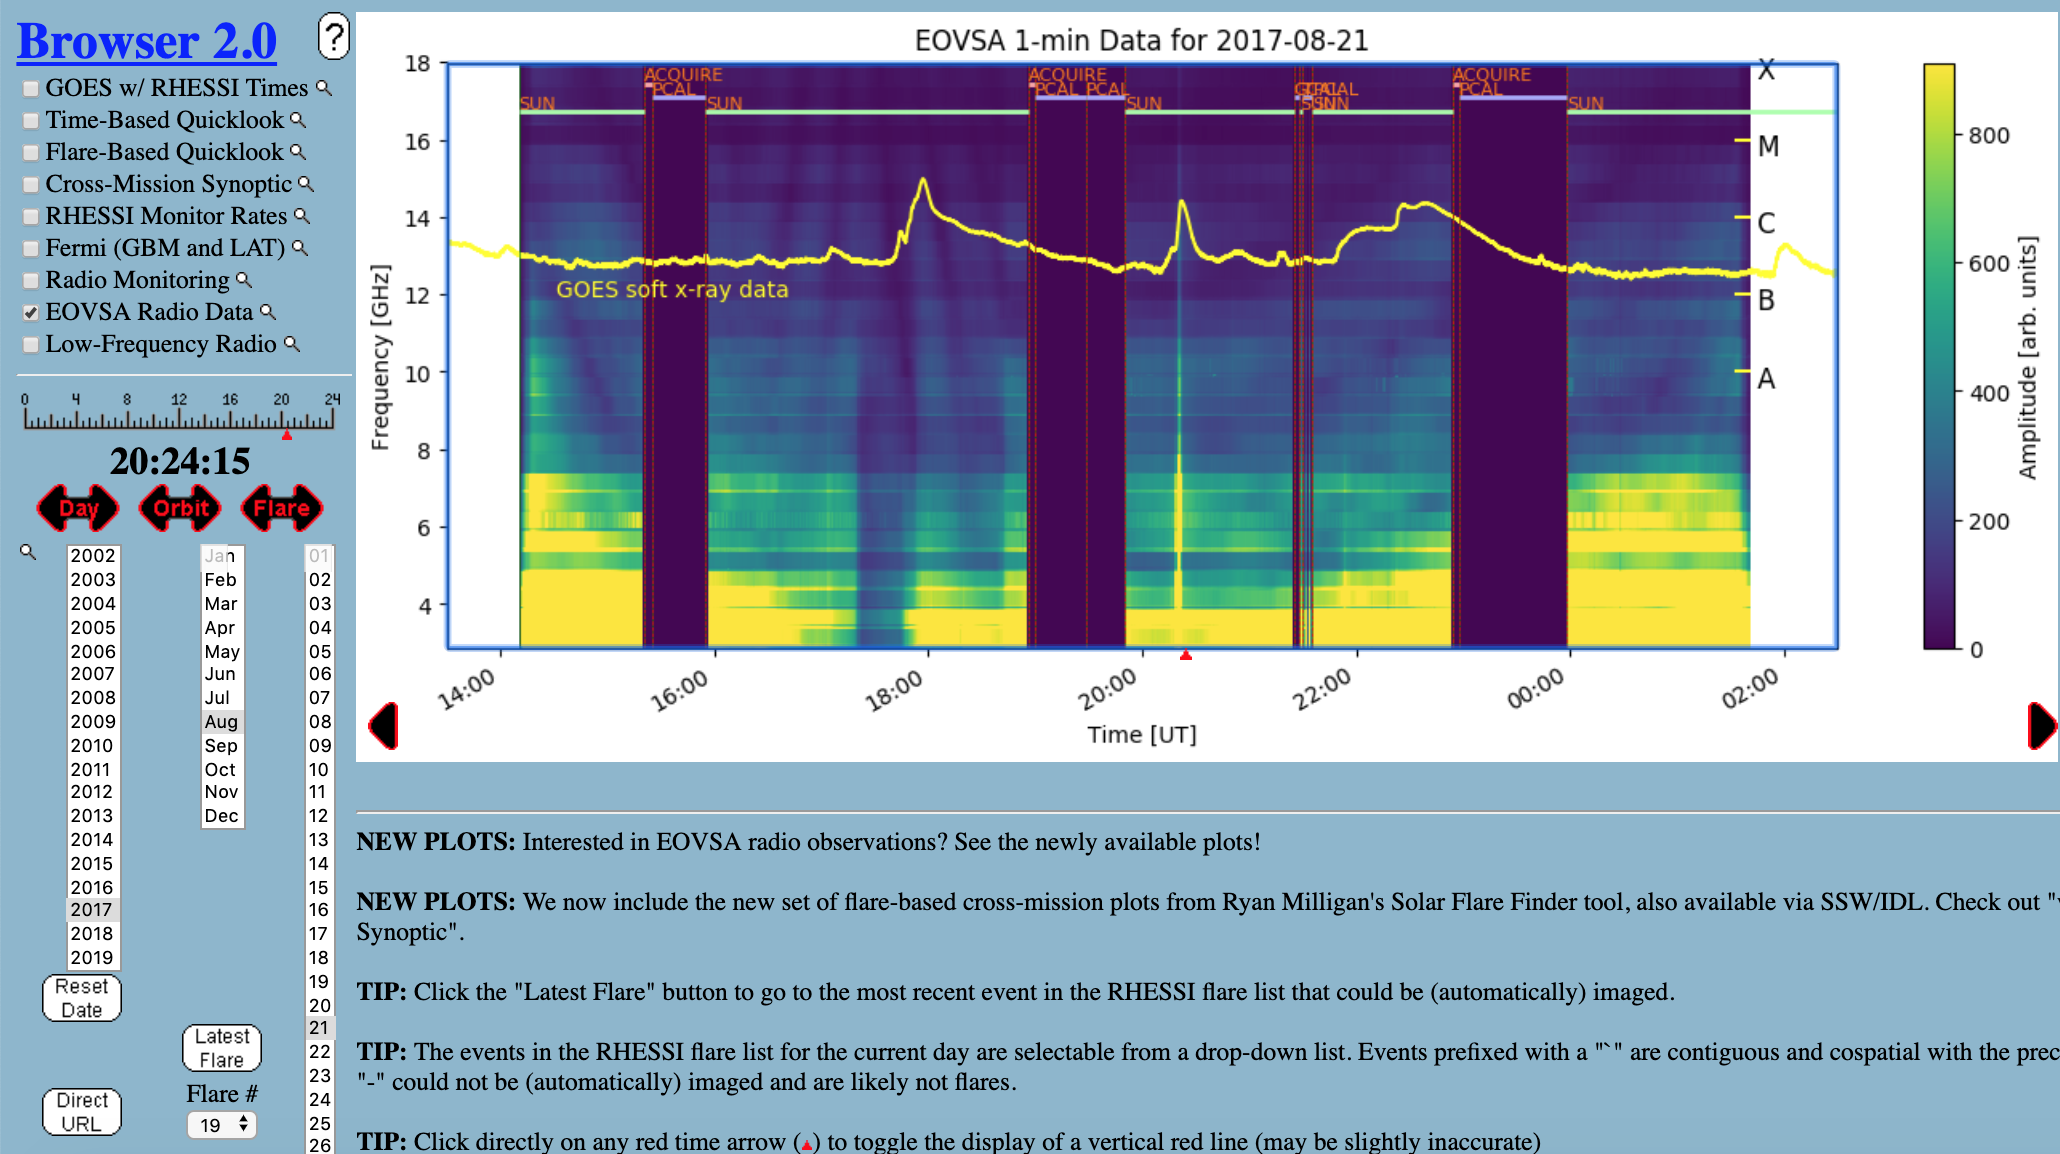
| 18:40, 15 May 2019 | Fig-browser.png (file) |  |
725 KB | Screenshot for viewing EOVSA all-day summary plot in RHESSI browser | 1 |
| 15:41, 5 October 2018 | VLA Pband 20181002.png (file) |  |
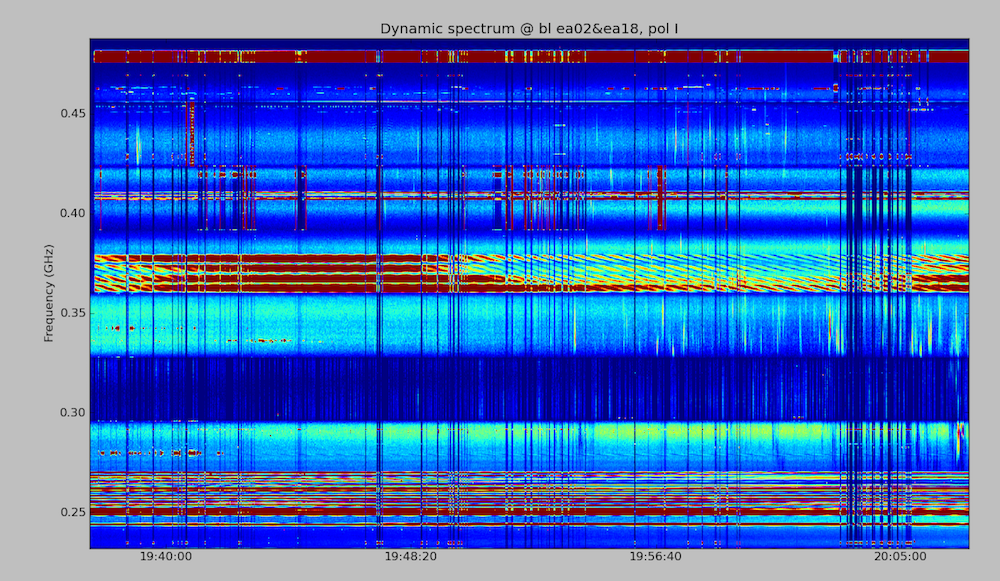
983 KB | Cross-power dynamic spectrum for VLA P band test observation on 2018 Oct 2. | 1 |
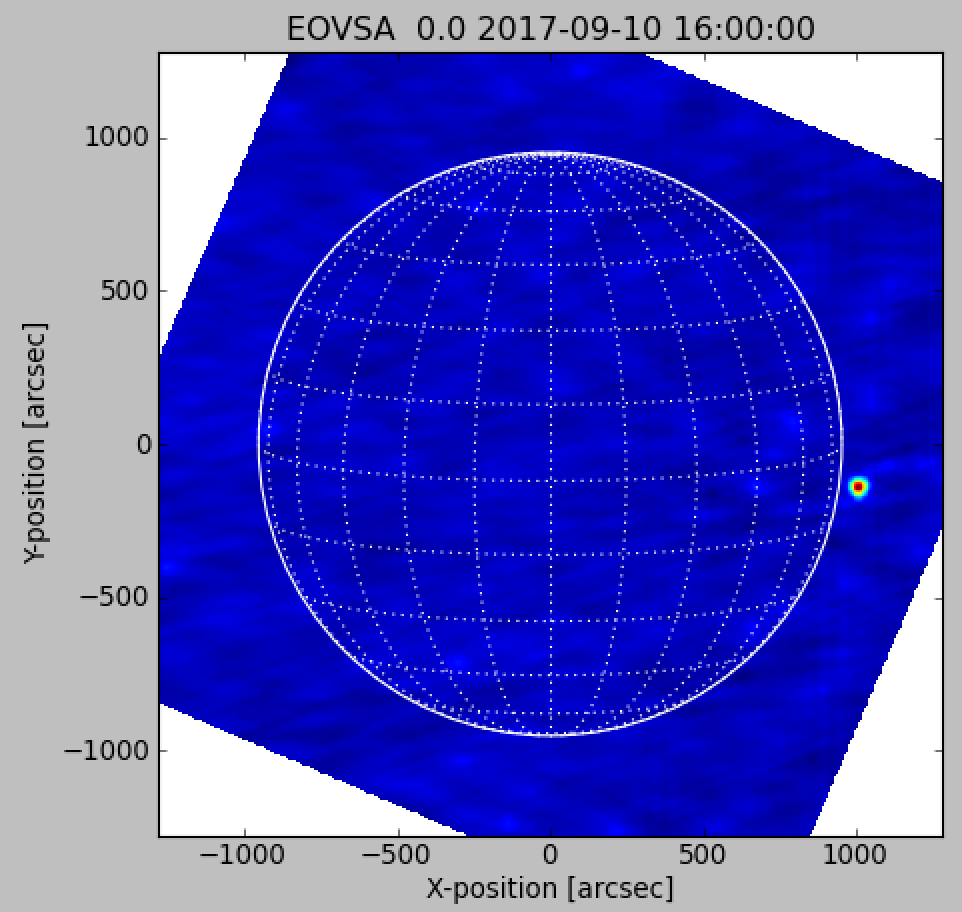
| 22:10, 3 January 2018 | Eovsa exampe flare image 20170910.png (file) |  |
240 KB | 1 | |
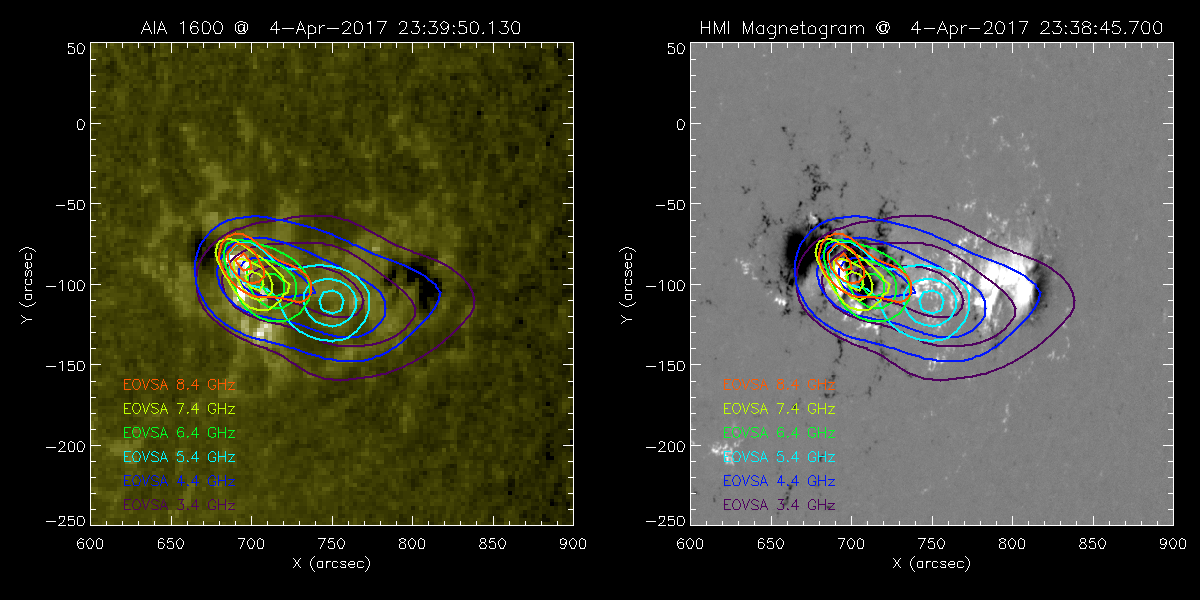
| 23:17, 18 May 2017 | Eovsa flare 20170404T233951.png (file) |  |
303 KB | 1 | |
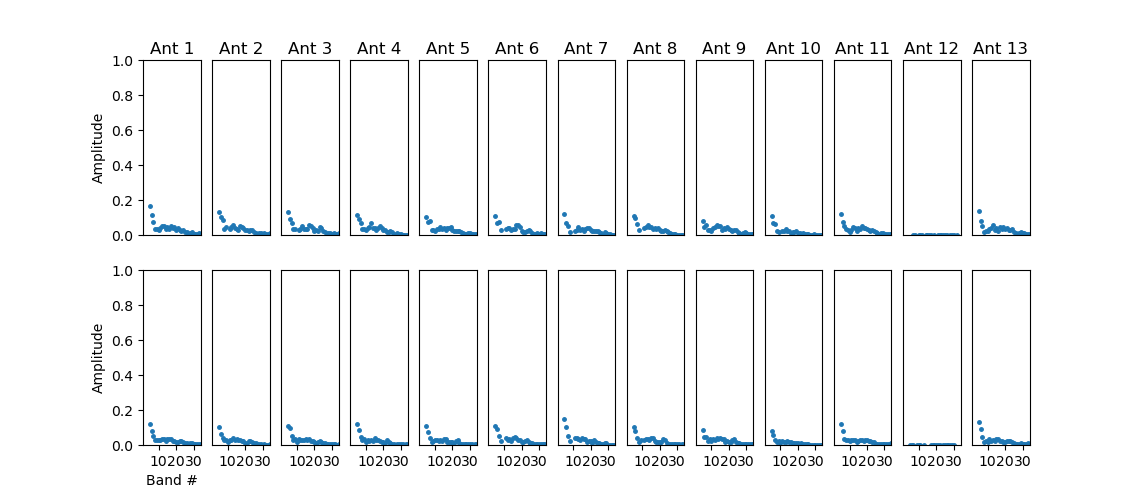
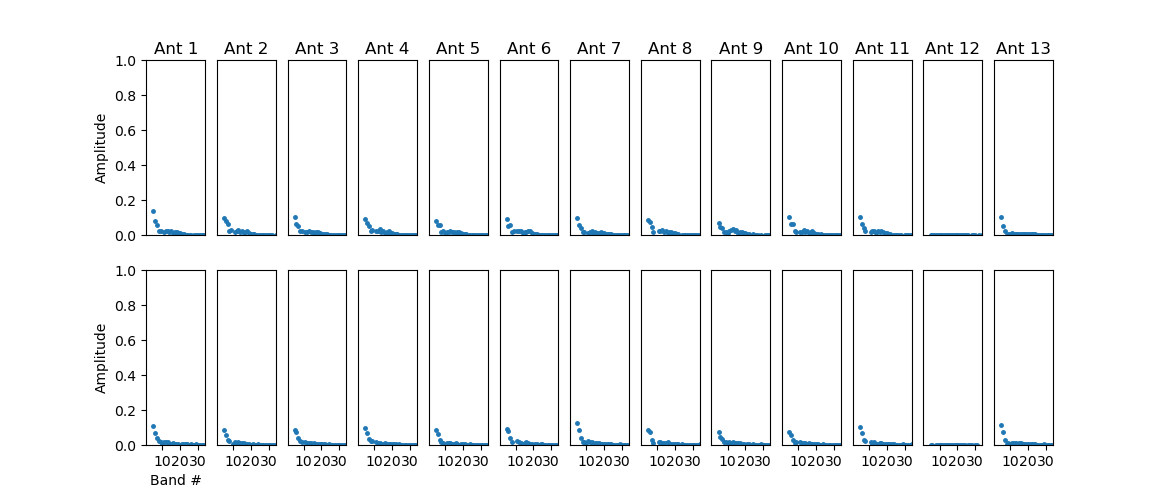
| 23:37, 16 May 2017 | 20170416 refcal amp.png (file) |  |
29 KB | 1 | |
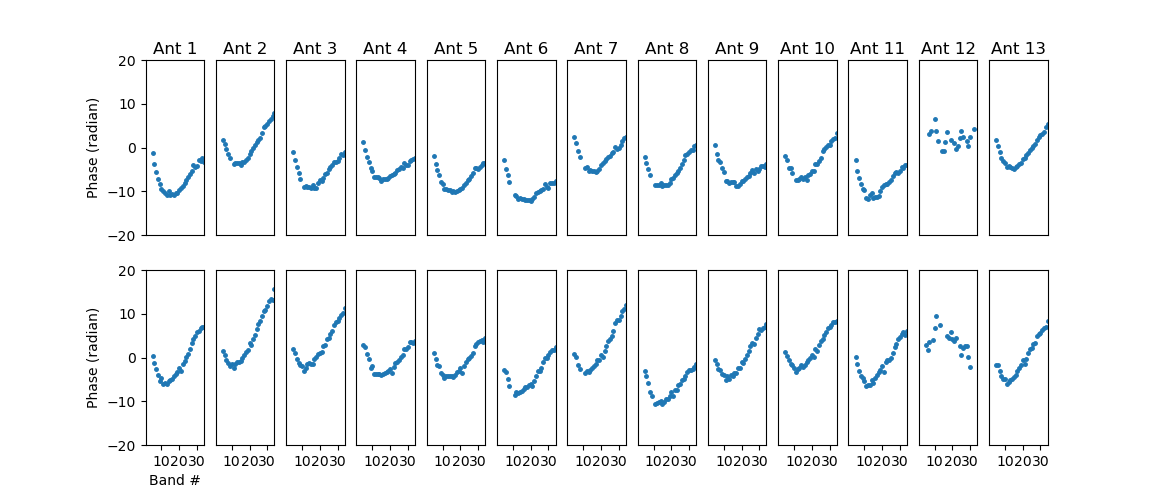
| 23:37, 16 May 2017 | 20170416 refcal pha.png (file) |  |
37 KB | 1 | |
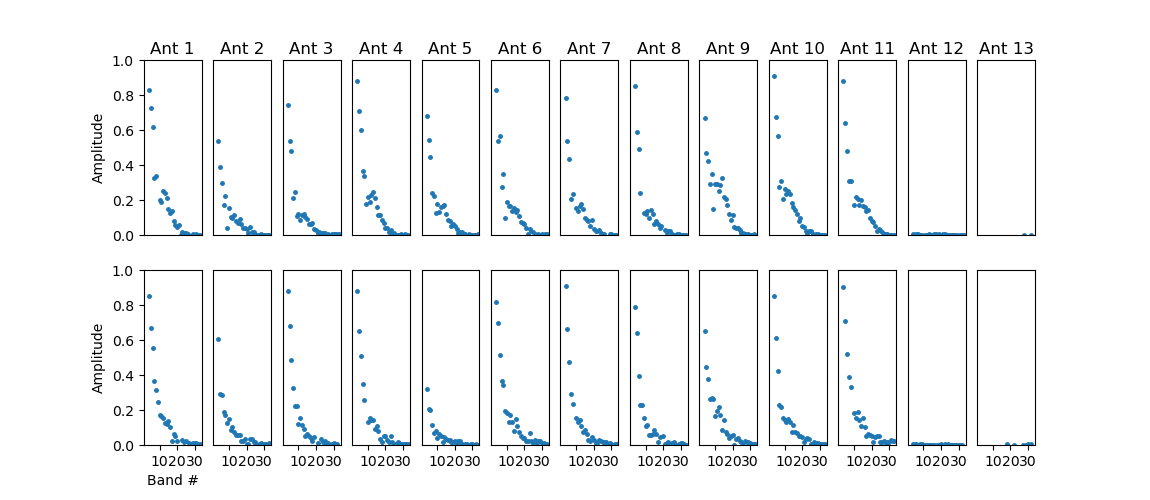
| 20:43, 16 May 2017 | 20170410 refcal amp.png (file) |  |
27 KB | 1 | |
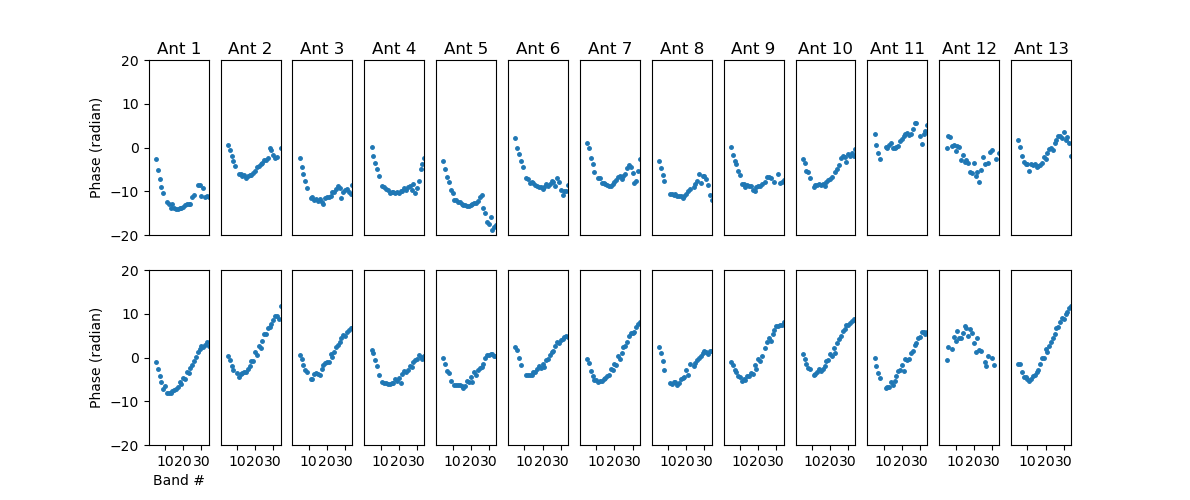
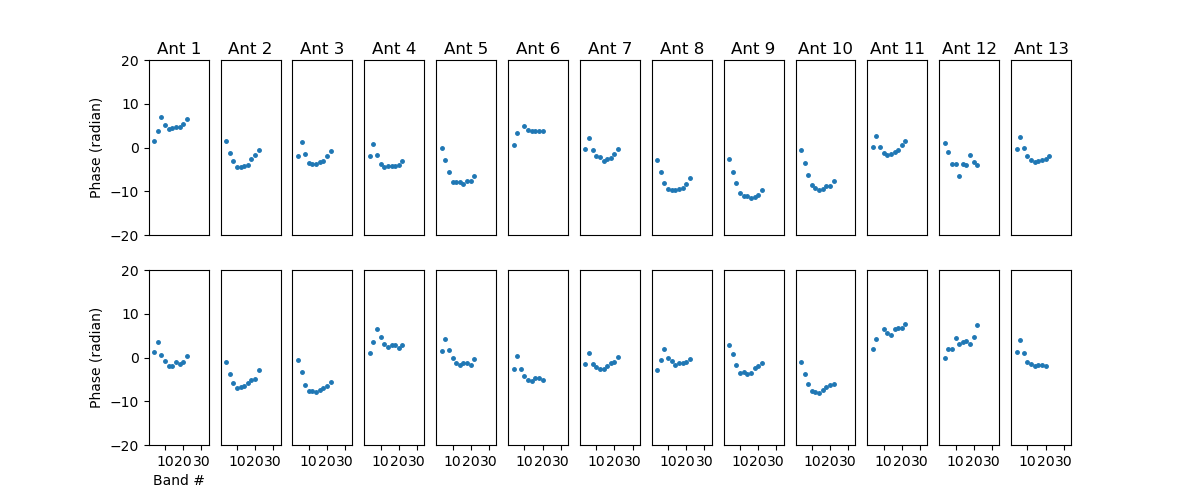
| 20:42, 16 May 2017 | 20170410 refcal pha.png (file) |  |
38 KB | 1 | |
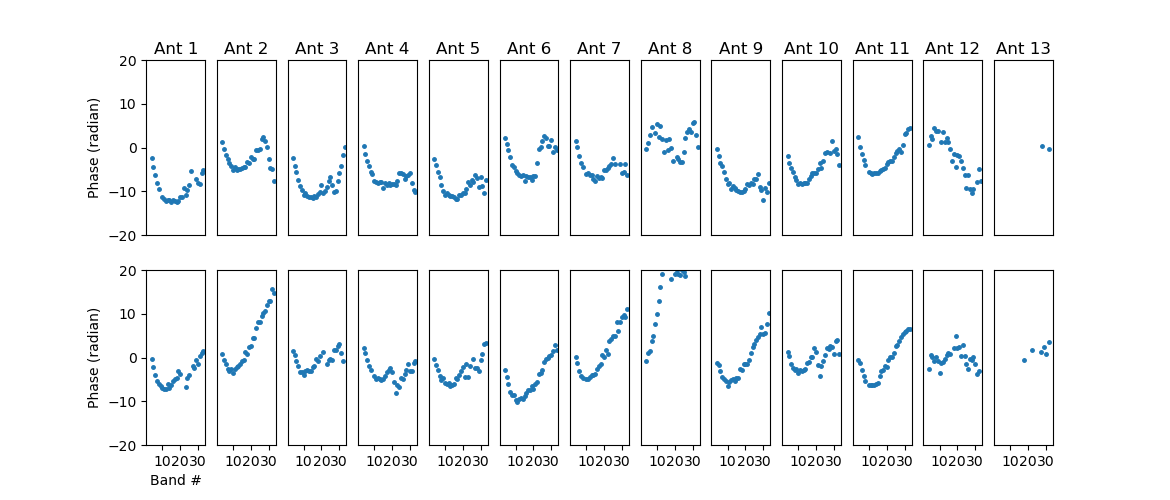
| 23:19, 15 May 2017 | 20170408 refcal pha.png (file) |  |
39 KB | 1 | |
| 23:19, 15 May 2017 | 20170408 refcal amp.png (file) |  |
35 KB | 1 | |
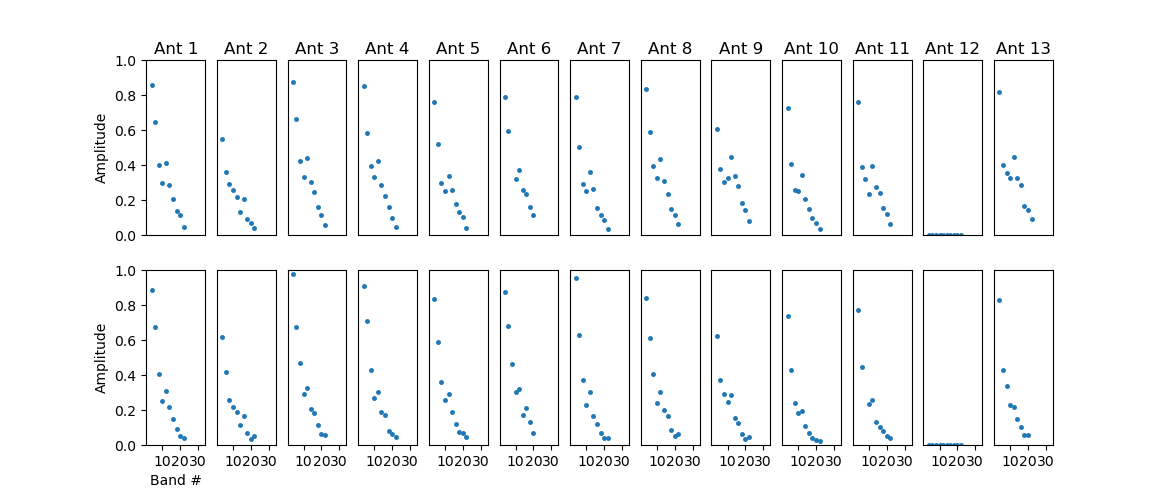
| 22:55, 15 May 2017 | 20170405 refcal amp.png (file) |  |
28 KB | 1 | |
| 22:55, 15 May 2017 | 20170405 refcal pha.png (file) |  |
28 KB | 1 | |
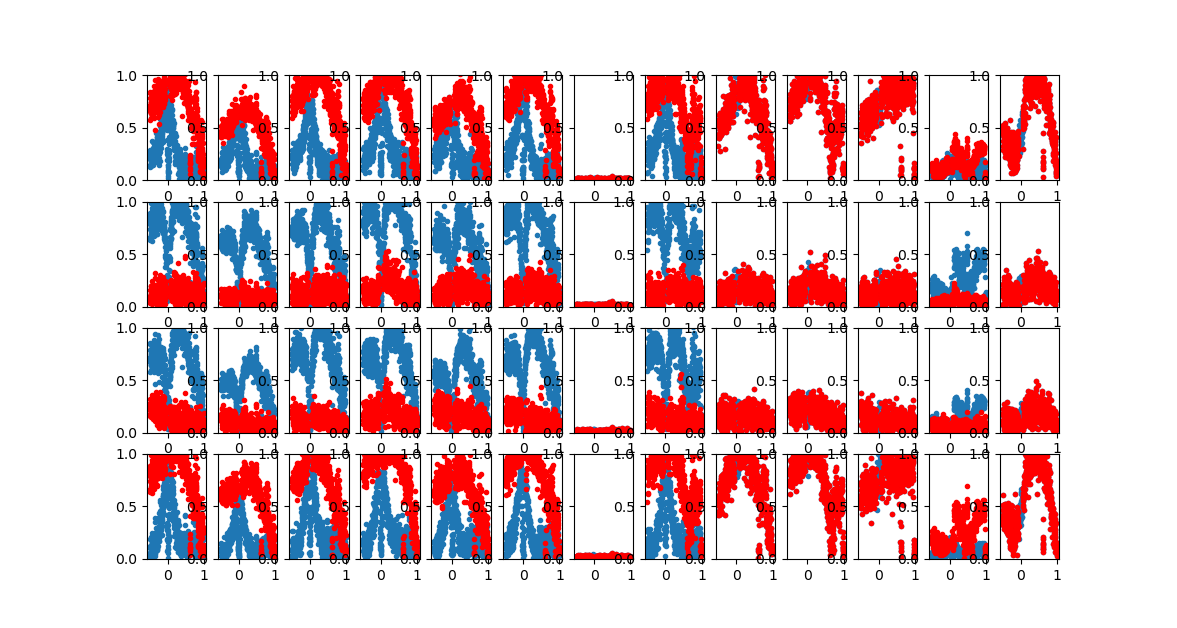
| 00:32, 6 January 2017 | Feed rot 20170104 3c84 corrected.png (file) |  |
169 KB | Amplitude vs. hour angle for all antennas (column) and polarizations (row; XX, XY, YX, YY). Blue is the original and red is the corrected. Observation was made on 2017 Jan 4 on 3C84. | 1 |
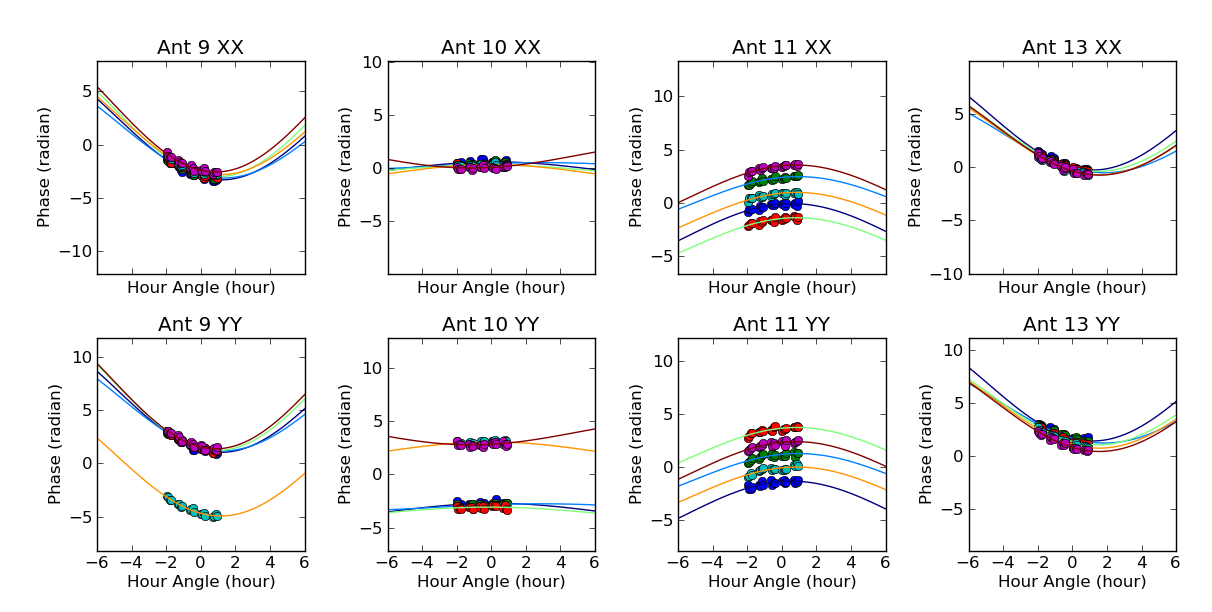
| 12:40, 20 November 2016 | Pha vs ha 2253+161 20161009 one fit.png (file) |  |
116 KB | Phase vs. hour angle for Antennas 9, 10, 11, 13 w.r.t. Antenna 14 at both XX and YY polarizations. This is based on an hour observation of 2136+006 (9.9 Jy at C band) and 2253+161 (10 Jy at C band) on 2016 Sep 7 under the fast frequency-sweeping mode o... | 1 |
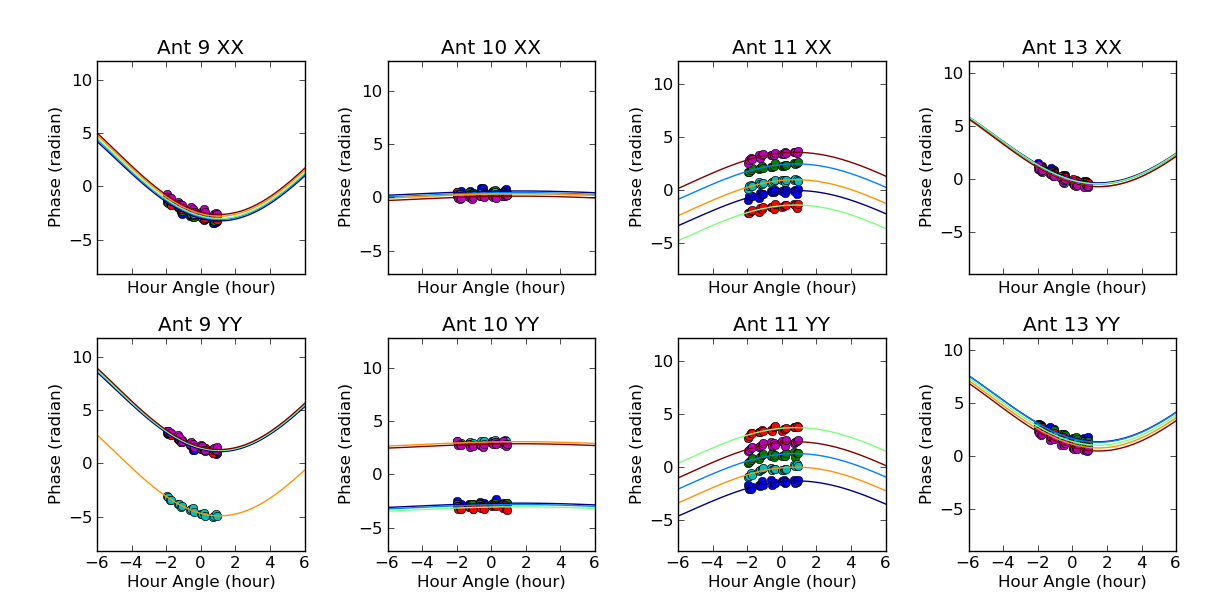
| 12:37, 20 November 2016 | Pha vs ha 2253+161 20161009 independent fits.png (file) |  |
125 KB | Phase vs. hour angle for Antennas 9, 10, 11, 13 w.r.t. Antenna 14 at both XX and YY polarizations. This is based on an hour observation of 2136+006 (9.9 Jy at C band) and 2253+161 (10 Jy at C band) on 2016 Sep 7 under the fast frequency-sweeping mode o... | 1 |
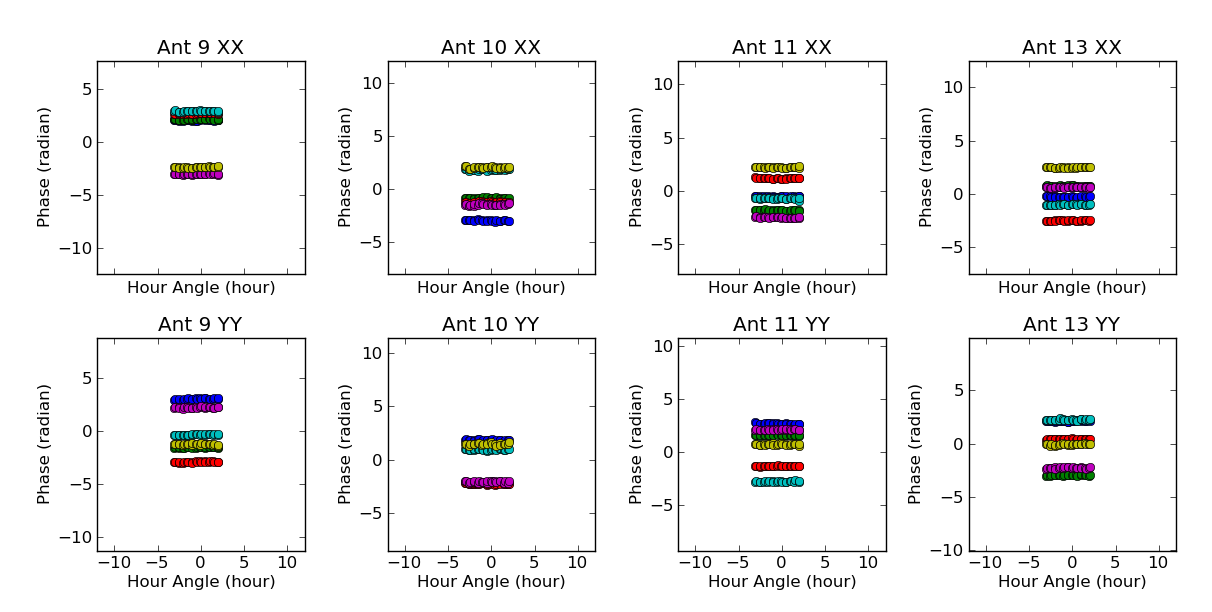
| 12:02, 20 November 2016 | Pha vs ha 0319+415 20160907 corrected.png (file) |  |
71 KB | Corrected phase vs. hour angle for Antennas 9, 10, 11, 13 w.r.t. Antenna 14 at both XX and YY polarizations. This is based on a ~5.5 hour observation of 3C84 on 2016 Sep 7. Different colors represent measurements/fits at different frequency channels. | 1 |
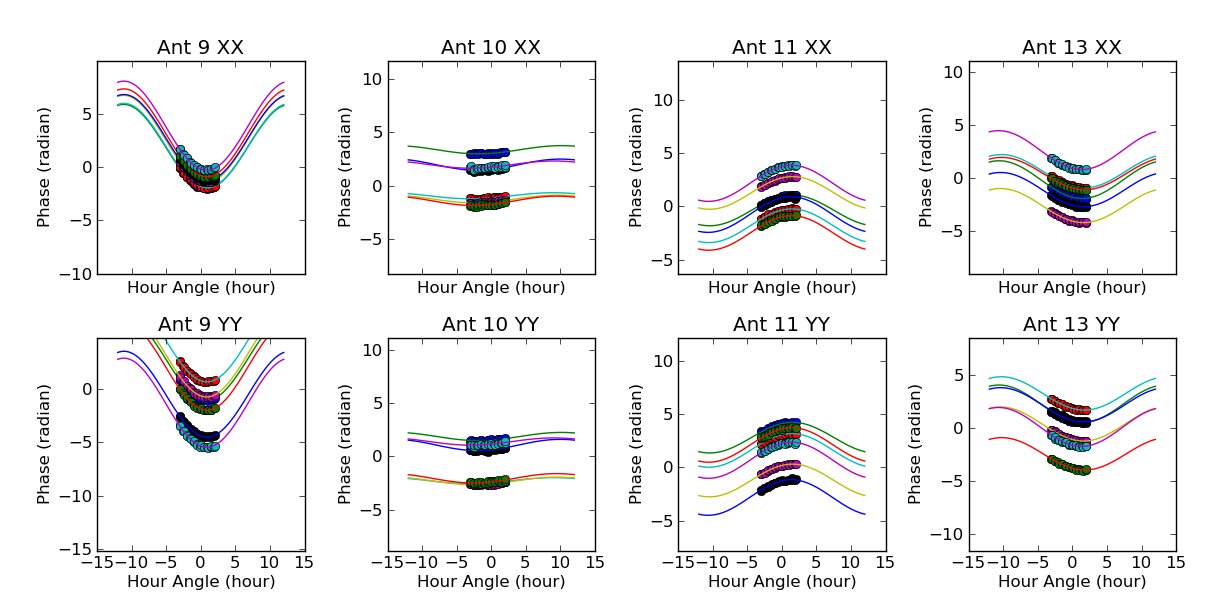
| 20:55, 19 November 2016 | Pha vs ha 0319+415 20160907.png (file) |  |
145 KB | Phase vs. hour angle for Antennas 9, 10, 11, 13 w.r.t. Antenna 14 at both XX and YY polarizations. This is based on a ~5.5 hour observation of 3C84 on 2016 Sep 7. Circular symbols are measured phases and curves are the corresponding sinusoidal curves.... | 1 |
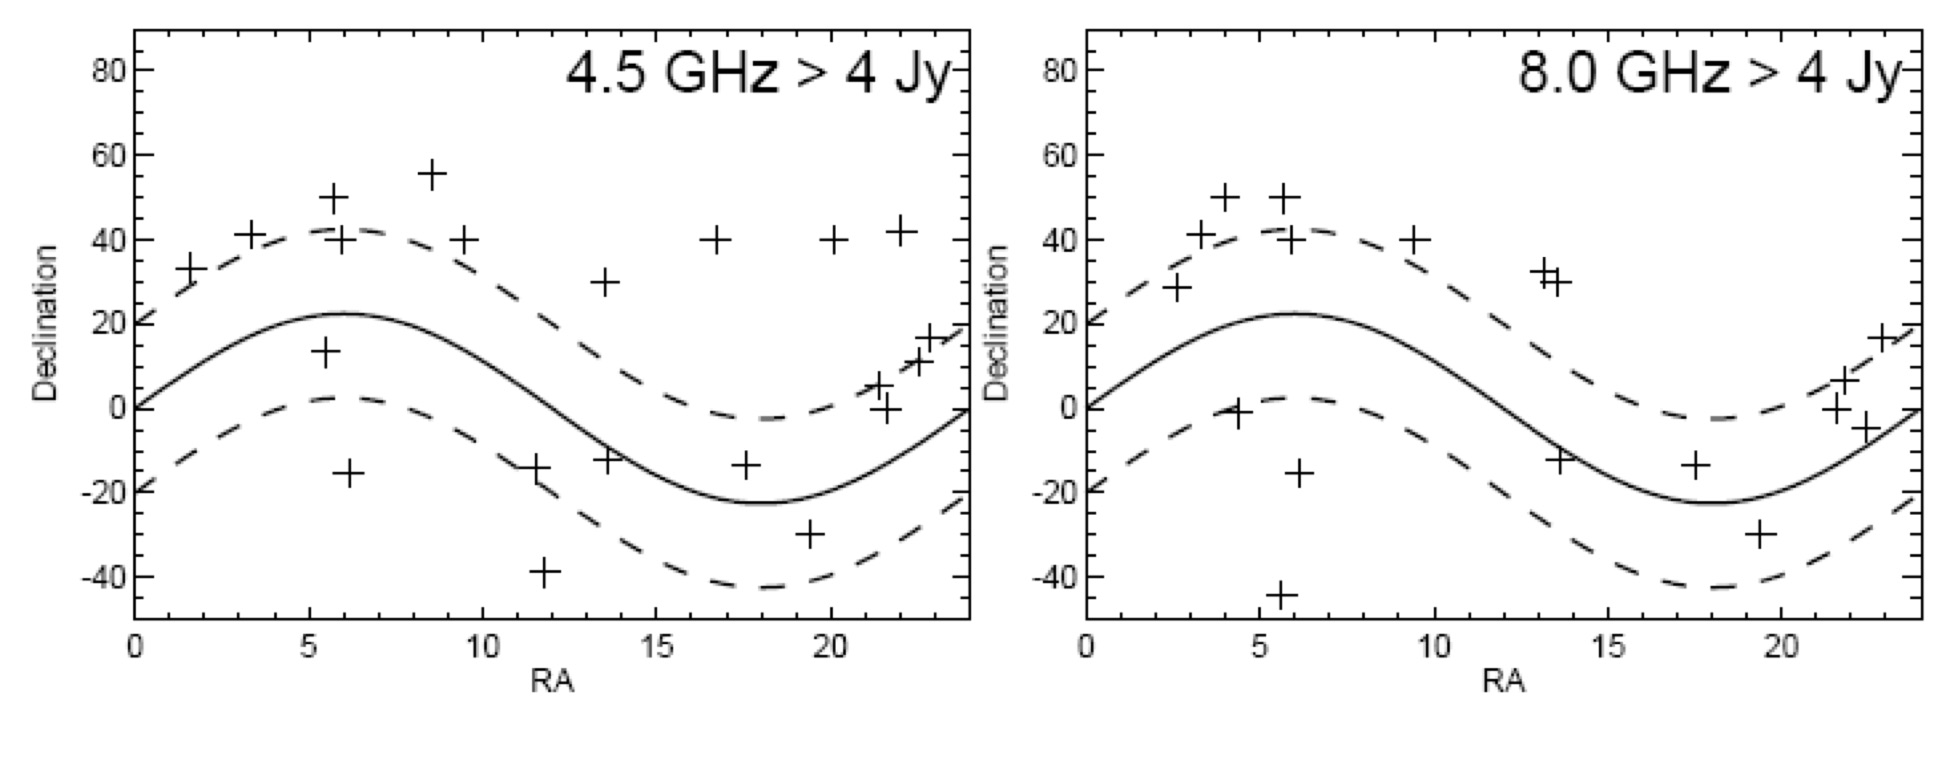
| 14:53, 24 September 2016 | Eovsa calib sources.jpg (file) |  |
134 KB | 1 | |
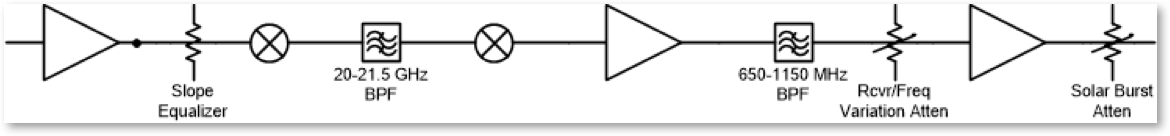
| 01:24, 5 August 2016 | Eovsa down converter block.png (file) | 40 KB | Block diagram of down-converter system | 1 | |
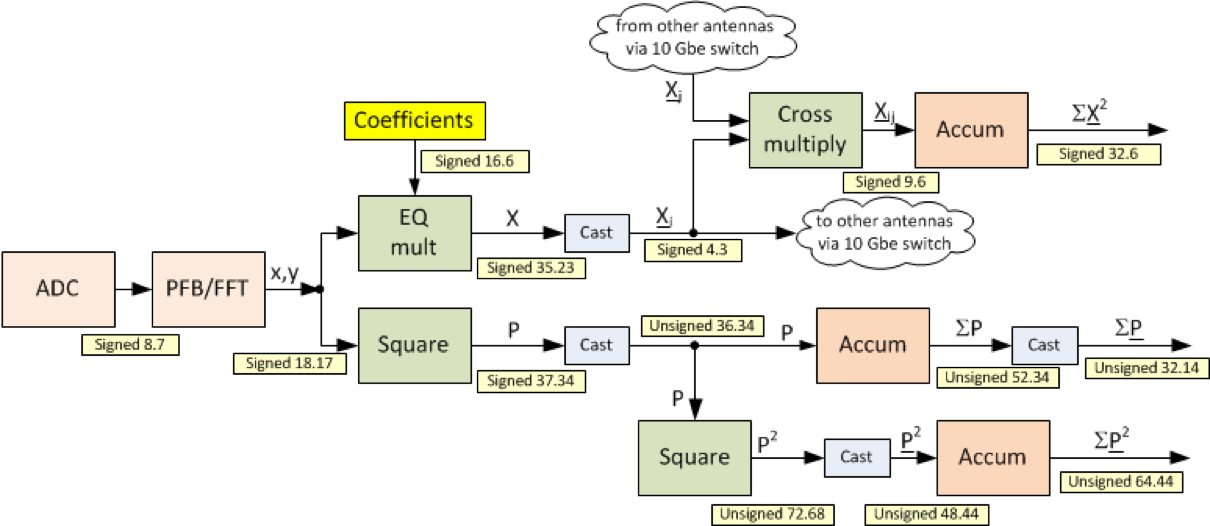
| 01:23, 5 August 2016 | Eovsa correlator block.png (file) |  |
131 KB | block diagram of digital correlator | 1 |
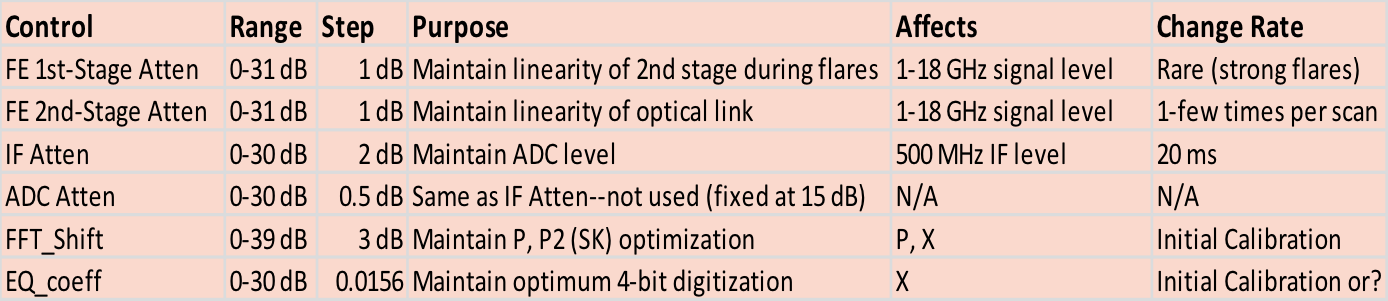
| 01:22, 5 August 2016 | Eovsa gain controls.png (file) | 103 KB | Summary of EOVSA gain control "knobs" | 1 | |
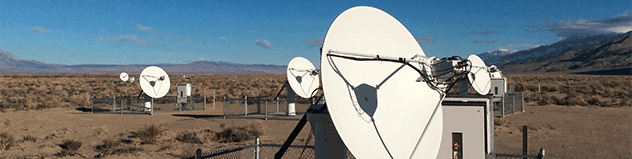
| 00:56, 5 August 2016 | Eovsa1.png (file) | 45 KB | EOVSA photo from array center | 1 |