OVSA Science Highlight No. 12: Harder Electrons in Brighter Microwave Flares
Contributed by Gregory D. Fleishman (Center for Solar-Terrestrial Research, New Jersey Institute of Technology); Edited by Sijie Yu. Posted on August 14, 2026.
Electron spectral hardness tracks microwave intensity across solar flares, suggesting a common acceleration track. Across 12 EOVSA microwave flares, brighter sources consistently contained harder populations of mildly relativistic electrons. The tight, nearly simultaneous relation links microwave intensity directly to the evolving electron spectrum.
Hard-X-ray studies have established two characteristic patterns in the spectral evolution of flare-accelerated electrons at tens of keV. Impulsive events typically show soft–hard–soft evolution, while some long-duration events show a soft–hard–harder pattern. Whether the mildly relativistic electrons traced by microwave emission follow comparable patterns has been much less clear.
Fleishman and colleagues addressed this question using EOVSA broadband imaging spectroscopy of 12 C- to X-class flares. By fitting the full gyrosynchrotron spectrum across each source and through time, they recovered the electron energy index \(\delta\) and the peak brightness temperature \(T_B\). A smaller \(\delta\) indicates a harder spectrum with proportionally more high-energy electrons, while \(T_B\) measures microwave intensity at the spectral peak.
The central result is a tight inverse relation between these quantities: as \(T_B\) increased, \(\delta\) decreased. Although the flares differed in duration, morphology, and intensity, their rising and decaying phases followed a similar hardness–intensity track. In almost every case, the two quantities varied with no resolved delay. The relation is therefore not simply a feature of one event or one phase of a flare. The full sample and representative event diagnostics are summarized in Figure 1.
Most flares also showed the familiar soft–hard–soft evolution, moving toward the hard, bright end of the relation and then returning as the emission faded. A few decay intervals remained hard or softened only weakly. These departures may reveal stronger trapping or delayed transport.
The common track provides a concise constraint for acceleration and transport models: any successful model must explain why microwave brightness and electron hardness evolve together across diverse flares. One possibility is that both respond to the balance among acceleration, escape, and energy loss. The observations do not identify a unique mechanism, and the sample was selected for imaging-spectroscopy quality rather than population statistics.
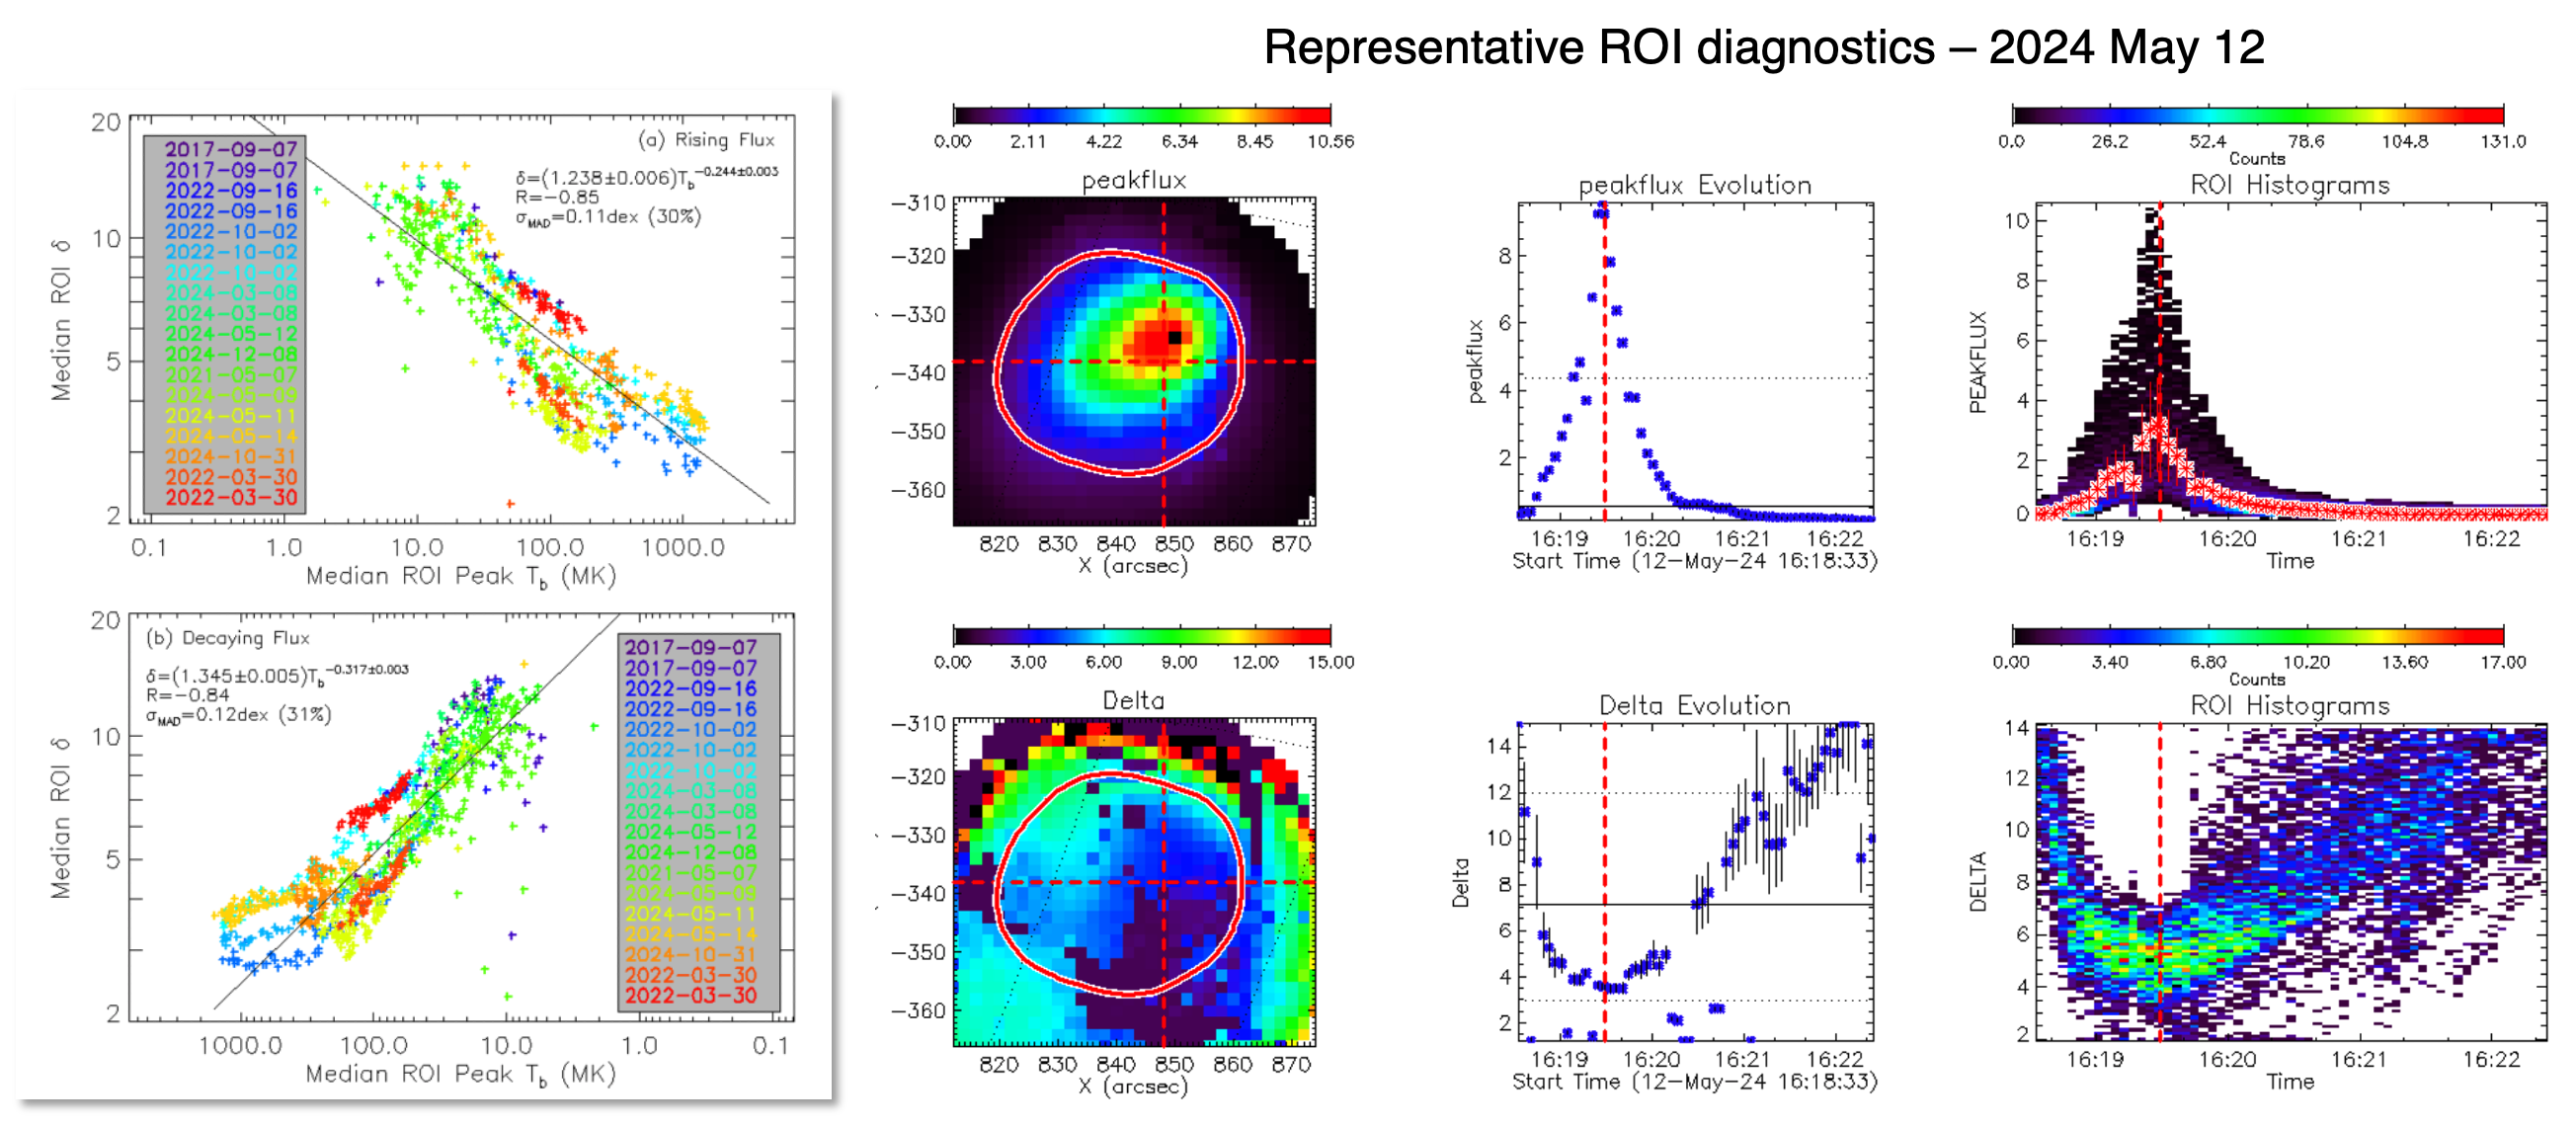
Figure 1. Microwave hardness–intensity relation across 12 EOVSA flares and representative diagnostics for the 2024 May 12 flare. (a,b) During both rising and decaying phases, the median nonthermal-electron power-law index \(\delta\) decreases as the median peak brightness temperature \(T_B\) increases, showing that brighter microwave sources have harder electron spectra. The x-axis in (b) is reversed so temporal evolution runs from left to right in both panels. The right-hand panels show peak flux (top row) and \(\delta\) (bottom row), shown from left to right as a spatial map, the time evolution at the selected pixel, and the evolving distribution within the source region. These diagnostic panels use peak flux, rather than \(T_B\), as the intensity measure. Adapted from Fleishman et al. (2026).
Source study: Fleishman et al., arXiv:2607.21874 (accepted to ApJ)